
Believing CPI Overstates Inflation Only Deepens the Food Puzzle
Food Puzzle: Part 11


We’ve already seen that the official Consumer Price Index (CPI) fails the Food Puzzle stress test, so the natural next question is whether a major critique of CPI does any better: the 1996 Boskin Commission. The Commission famously concluded that CPI most likely overstates inflation by about 1.1 percentage points per year, with a plausible range of 0.8–1.6. In its own words, changes in the CPI “have substantially overstated the actual rate of price inflation, by about 1.3 percentage points per annum before 1996 (the extra 0.2 percentage point is due to a problem called formula bias inadvertently introduced in 1978 and fixed this year),” and it is “likely that a large bias also occurred looking back over at least the last couple of decades” (Boskin et al., 1996)
How to Read the Data in This Post
Unless otherwise noted, all dollar figures in this section are expressed in 2024 dollars using CPI‑U or a Boskin‑style adjustment to CPI‑U, as specified in each table or figure. The charts and tables draw on standard public datasets, USDA (NASS and ERS), BLS, Census, FRED, and widely used population estimates, so nothing here depends on exotic or private sources. Where I use Boskin’s adjustment, the goal is to test his framework against the Food Puzzle, not to present it as the default method for measuring inflation. To keep the main story readable, I limit in‑text citations and technical details; each figure has a short caption explaining how it was calculated and which datasets it uses, including whether it relies on official CPI or on the Boskin‑adjusted path. A Methods and Sources section at the end lists all underlying series, transformations, and inflation adjustments, so anyone who wants to audit or recreate the charts can do so.
Re‑testing CPI with the Boskin Commission Thesis
To test this view against the Food Puzzle, we apply Boskin’s estimated bias retroactively: subtracting 1.3 percentage points from reported CPI inflation each year from 1980 to 1995, and 1.1 percentage points from 1996 onward. This isn’t just Boskin’s number in isolation; most mainstream “CPI is too high” critiques cluster in that same 0.8–1.6 percent band. Meaning that if Boskin’s adjustment fails this test, any similar adjustment will fail with it. As we will see, this correction makes the Food Puzzle worse, not better. Adjusted numbers make real food prices look even higher over time, despite the massive productivity gains documented in earlier parts of this series (Boskin et al., 1996).
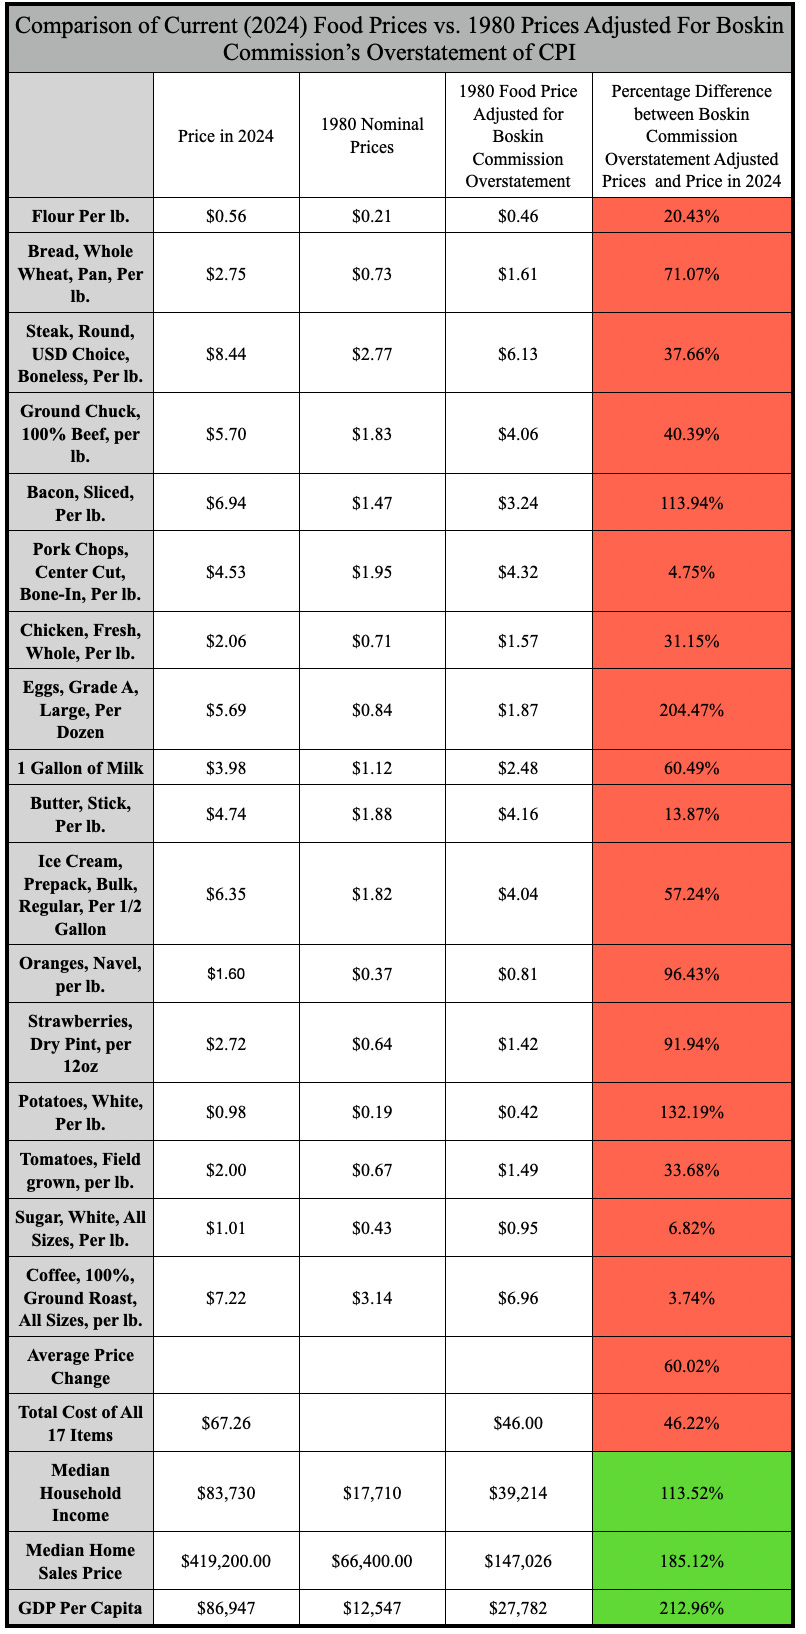
What Boskin’s Fix Does to Food Prices
Using the same 17 staple foods from Part 10 that we used to critique the official CPI, we now take their 1980 prices and carry them forward to 2024 dollars under the Boskin methodology. Under this adjustment, every single item ends up more expensive in real terms in 2024 than in 1980. Standard CPI at least shows modest declines in some categories, such as chicken and potatoes. Boskin’s correction erases those gains and turns them into increases. In a sector where productivity has clearly exploded, that is the opposite of what we should expect.
Boskin’s Story vs. the Cost of Living
This is especially striking when you consider the Boskin Commission’s main narrative, which rests on a simple idea about how people shop. Their argument rests on structural changes that should lower the cost of living: consumers shifting to discount stores, new outlets, and cheaper substitutes, so that a given standard of living should require less income than the CPI implies. Yet when we apply their own correction to basic foods, every price in the test basket rises in real terms. That is a strange way to demonstrate an improvement in living standards (Boskin et al., 1996).
It also collides with how the Boskin findings have been used in policy debates. If CPI has been overstating inflation, then Social Security, pensions, and other CPI‑linked benefits have been rising faster than necessary to maintain a given standard of living, so policymakers have argued that future cost‑of‑living adjustments can safely grow more slowly. In plain terms, that means slower growth in inflation‑adjusted incomes for millions of households. If the Boskin-adjusted numbers indicate that food is getting more expensive across the board, then it is hard to reconcile that with the idea that smaller cost-of-living increases are enough to keep those households whole.
Incomes, Generations, and the Squeezed Middle
The contradiction becomes even starker when we extend the adjustment to broader economic indicators and incomes. Under Boskin’s logic, real average wages have risen 113% since 1980, and real GDP per capita has grown 213%. To see what that means in everyday terms, consider how their adjustment affects the income numbers: the 1980 median household income of $17,710 becomes roughly $39,000 in 2024 terms. On paper, that implies that a reasonable real income level today should buy a clearly better standard of living than it did in 1980. In that story, a typical worker or median‑income household should feel far more comfortable than their parents did; homes should be more affordable, raising children should be easier, and moving up the ladder should be more common.
Economists often respond that a household on 39,000 dollars today enjoys far better technology and conveniences than a similar‑income family in 1980, and that is true: smartphones, streaming, and modern appliances are real gains. But in a society that keeps accumulating knowledge and engineering know‑how, it would be strange if the average home didn’t have better technology than in the past; that is the natural trajectory of a progressing economy, not evidence that everything else is fine.
Those visible gadgets also make an easy scapegoat for stagnating living standards, even though most of them are occasional or one‑time purchases, not the recurring costs that determine whether a budget balances each month. When we look at the essentials, housing, food, energy, and childcare, a $39,000 income leaves very little room to cover the basics, let alone save or build security. In practice, most households need a much higher income than that just to participate in today’s society without constant financial strain.
Yet the opposite is widely observed. Homeownership rates for under‑35s have fallen sharply, fertility rates are at historic lows, and a recent Pew survey found that 74% of Americans describe current economic conditions as only fair or poor. Intergenerational mobility data tell the same story. Roughly 90% of children born in the 1940s earned more than their parents, compared with less than half of those born in the 1980s. In many parts of the country, even households near today’s median income report that housing, childcare, and groceries leave little room for savings or security, which is hard to reconcile with charts that say real incomes have more than doubled (Feiveson, 2024, Lautz, 2025, Walsh 2026, & Copeland, 2025).
Boskin’s adjustment also quietly rewrites the story of how life supposedly got better. It implies that most of the improvement we have seen in hours worked to buy a standard basket of goods comes not from correctly measured price relief, but almost entirely from rising incomes. There is little evidence for that. Even under standard assumptions, a world of strong productivity and rapid real wage growth should produce broad, felt gains in affordability, not a generation that feels squeezed while the charts say they are winning.
What Boskin Gets Right—and Wrong
If the Boskin Commission were correct about the direction of CPI’s bias, we would not be living through the cost‑of‑living crisis that defines today’s economy. Their discussion of specific measurement issues, substitution bias, quality change, and new goods was insightful, and many of their technical recommendations were eventually adopted by the BLS. But their core diagnosis, that these flaws cause CPI to overstate inflation, points the wrong way. In a sector where productivity is powerfully deflationary, the evidence from food, wages, and housing suggests that the real bias in CPI is understatement of deflation, not overstatement of inflation.
This analysis does not dismiss the Boskin report outright; it builds on its foundation while flipping the interpretation. The evidence from food prices, wages, housing, and mobility suggests that the Commission identified real measurement issues but misdiagnosed their net effect on the cost of living. That misdiagnosis leaves the Food Puzzle, and much of the perceived stagnation of recent decades, unresolved. And if trimming a little inflation off the top makes the paradox worse, the natural next question is whether going to the opposite extreme, claims that CPI has understated inflation by as much as 7 percentage points a year since 2000, can do any better.
Next: Now the opposite extreme. What if CPI understates inflation far more than 1.5%. Continue to "Why Severe Understatement of Inflation Goes Too Far."
Methods and Sources
Comparison of Current (2024) Food Prices vs. 1980 Prices Adjusted for Boskin Commission’s Overstatement of CPI
All price and income figures are converted to 2024 dollars using a Boskin‑style adjustment to CPI‑U before comparison.
Food item prices: For each of the 17 food items, nominal monthly prices for 1980 and 2024 are taken from the BLS Average Price (AP) series and averaged over the 12 months to get an annual price for each year. The 1980 annual prices are then multiplied by an adjusted CPI ratio that subtracts the Boskin Commission’s estimated bias from reported inflation (1.3 percentage points per year from 1980–1995, 1.1 points from 1996 onward) before rolling 1980 forward to 2024. This produces Boskin‑adjusted 2024‑dollar values, which are compared with actual 2024 prices to compute percentage differences. The “average price change” row is the simple mean of these 17 percentage differences.
Income, housing, and rent: Median household income is taken from Census historical income tables; median home prices from the FRED MSPUS series. The 1980 values are inflated to 2024 dollars using the Boskin‑adjusted CPI series before computing percentage differences, so that income and housing are treated on the same basis as the food basket.
GDP per capita: GDP levels are assembled from MeasuringWorth and FRED, with population from Maddison‑style estimates and Macrotrends. I compute GDP per capita as real GDP ÷ population, then express the 1980 value in 2024 dollars using the Boskin‑adjusted CPI series where needed, to match the treatment of other income variables.
Sources
Bolt, J., & van Zanden, J. L. (2024). Maddison style estimates of the evolution of the world economy: A new 2023 update. Journal of Economic Surveys, 38(1), 1–41. https://doi.org/10.1111/joes.12618
Boskin, M. J., Dulberger, E. R., Gordon, R. J., Griliches, Z., & Jorgenson, D. W. (1996). Toward a more accurate measure of the cost of living: Final report to the Senate Finance Committee from the Advisory Commission to Study the Consumer Price Index. U.S. Senate Committee on Finance. https://www.ssa.gov/history/reports/boskinrpt.html
Bureau of Labor Statistics. (2026). Consumer price index for all urban consumers (CPI‑U) [Data set]. U.S. Department of Labor. https://www.bls.gov/cpi/
Copeland, J. (2025, October 3). Most Americans continue to rate the U.S. economy negatively as partisan gap widens. Pew Research Center. Retrieved January 7, 2026, from https://www.pewresearch.org/short-reads/2025/10/03/most-americans-continue-to-rate-the-us-economy-negatively-as-partisan-gap-widens/
Federal Reserve Bank of St. Louis. (2024). Gross domestic product (GDP) [Data set]. FRED, Federal Reserve Bank of St. Louis. https://fred.stlouisfed.org/series/GDP
Federal Reserve Bank of St. Louis. (2024). Median sales price of houses sold for the United States (MSPUS) [Data set]. FRED, Federal Reserve Bank of St. Louis. https://fred.stlouisfed.org/series/MSPUS
Feiveson, L. (2024, December 18). How does the well‑being of young adults compare to that of their parents? U.S. Department of the Treasury. Retrieved January 6, 2026, from https://home.treasury.gov/news/featured-stories/how-does-the-well-being-of-young-adults-compare-to-their-parents
Lautz, J. (2025, January 7). Young buyers continue to be fenced out of homeownership. National Association of Realtors. Retrieved January 7, 2026, from https://www.nar.realtor/blogs/economists-outlook/young-buyers-continue-to-be-fenced-out-of-homeownership
Macrotrends. (2025). United States population 1820–2024 [Data set]. Macrotrends LLC. https://www.macrotrends.net/global-metrics/countries/usa/united-states/population
U.S. Bureau of Labor Statistics. (2024). Average price data (AP), U.S. city average [Data set]. U.S. Department of Labor. https://www.bls.gov/charts/consumer-price-index/consumer-price-index-average-price-data.htm
U.S. Census Bureau. (2024). Historical income tables: Households [Data set]. U.S. Department of Commerce. https://www.census.gov/data/tables/time-series/demo/income-poverty/historical-income-households.html
Walsh, R. (2026, January 6). Does the U.S. have a fertility crisis? Johns Hopkins Bloomberg School of Public Health. Retrieved January 7, 2026, from https://publichealth.jhu.edu/2026/is-the-us-birth-rate-declining
Williamson, S. H. (2025). What was the U.S. GDP then? MeasuringWorth. http://www.measuringworth.org/usgdp/
Author: Kyle Novack
April 21, 2026
A Monumental Venture, LLC: research project (Novack Equilibrium Theory – NETs)
Attribution Required: © 2025–2026 Kyle Novack / Monumental Venture, LLC. For educational use with credit; commercial use requires permission. Full details in linked PDFs.