
Big Food and Greedflation: What the Margins Actually Show
Food Puzzle: Part 6

In previous sections, we walked through the post-farm supply chain and found little evidence that packaging, transportation, or grocery-sector labor quietly swallowed the farm-productivity dividend. Real per capita costs in those categories tended to be flat or falling after adjusting for CPI to create 2024 dollars, and productivity outside the farm gate generally improved rather than deteriorated. If the savings did not disappear into trucks, boxes, or checkout lanes, the next logical turn is to the largest remaining suspect: market power and corporate capture
It is now time for the corporations themselves to take the witness stand. The charge is straightforward: large food companies use their size and market power to squeeze suppliers on input prices while keeping shelf prices elevated for consumers. The gap between falling internal costs and rising final prices translates into permanently higher profits for executives and investors. This is the narrative commonly called “greedflation.”
That charge has real emotional force. Shoppers see grocery bills rising and read about consolidation in meatpacking, soft drinks, snacks, and packaged goods. It is natural to suspect that concentrated corporate power is quietly capturing the productivity dividend that should have reached households. But an emotional narrative is not the same as evidence. We need to examine the financial records directly (Ryan, 2024).
How to Read the Data in This Section
All numbers and charts in this part of the Food Puzzle draw on standard public data sets, including USDA Food Expenditure and Food Dollar tables, BLS labor and wage series, official CPI indexes, and the published annual reports and Form 10‑K filings of major food companies. To avoid clutter, I keep in‑text citations brief; each figure has a short note on how it was constructed, and a detailed “Methods and data sources” section at the end lists every underlying series so that readers can audit or replicate the calculations. Unless otherwise noted, all dollar amounts in this section are adjusted for inflation using the CPI‑U and expressed in constant 2024 dollars, while ratios such as profit margins and revenue shares are calculated in nominal terms.
Tyson, the Meat Industry Giant
Meatpacking is often presented as the prime example. Commentators note that a handful of meatpacking giants control much of the fed‑cattle market and argue that they can manipulate prices, labeling, and supply in ways that hurt both ranchers and consumers. They conclude that these pressures cause beef prices to increase, including double-digit rises in 2025, as apparent proof that concentrated corporate power is driving inflation. On the surface, this appears to be a strong case for treating large food companies as the main suspects (Rechenberg, 2025).
To see whether that intuition holds up under scrutiny of the data, we start with one of the most visible firms in the sector: Tyson Foods. If a company with substantial scale is quietly keeping the productivity dividend for itself, we would expect to see the evidence in its operating margins, the percentage of revenue left after paying for cost of goods sold (COGS) and operating expenses. Over the 1997–2025 period, Tyson’s operating margins averaged in the mid‑single digits, with a clear but temporary spike around 2021–2022 when inflation was elevated across the economy. After that spike, margins fall back toward the lower end of their historical range, and the company even records an operating loss in 2023.
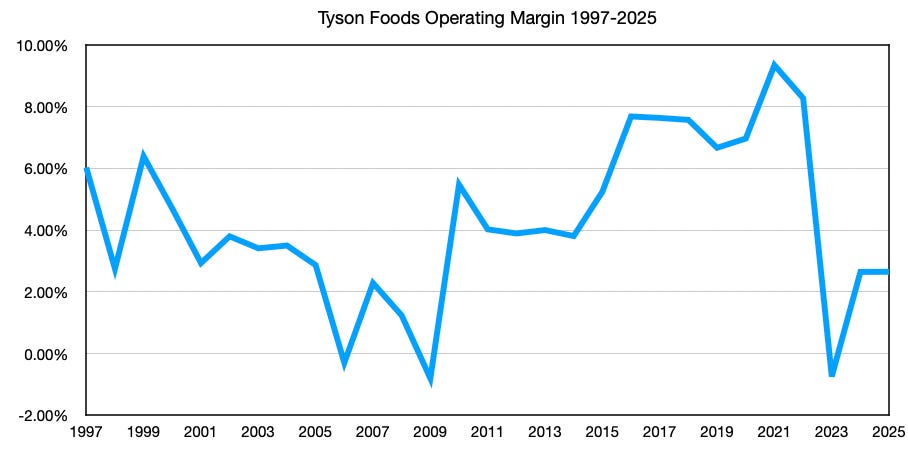
Those patterns matter because they sit alongside persistent food inflation. According to the CPI for food in U.S. city averages, food prices rose by almost 32% between January 2020 and December 2025, and many households feel the increase is larger in their own budgets. If Tyson were using that environment to permanently widen the gap between prices and costs, we would expect to see a clear step‑up in profitability that stays in place. Instead, we see a temporary surge followed by a reversal toward past norms. Tyson does not appear to be a firm that has locked in a new era of structurally higher margins at the expense of consumers (U.S. Bureau of Labor Statistics, 2026).
Examining Financials for 10 Large Food Companies
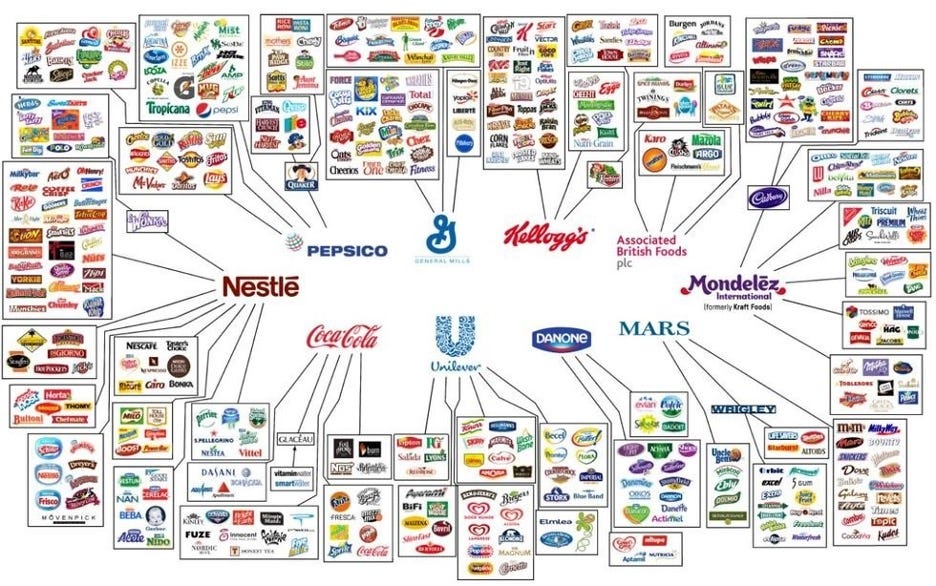
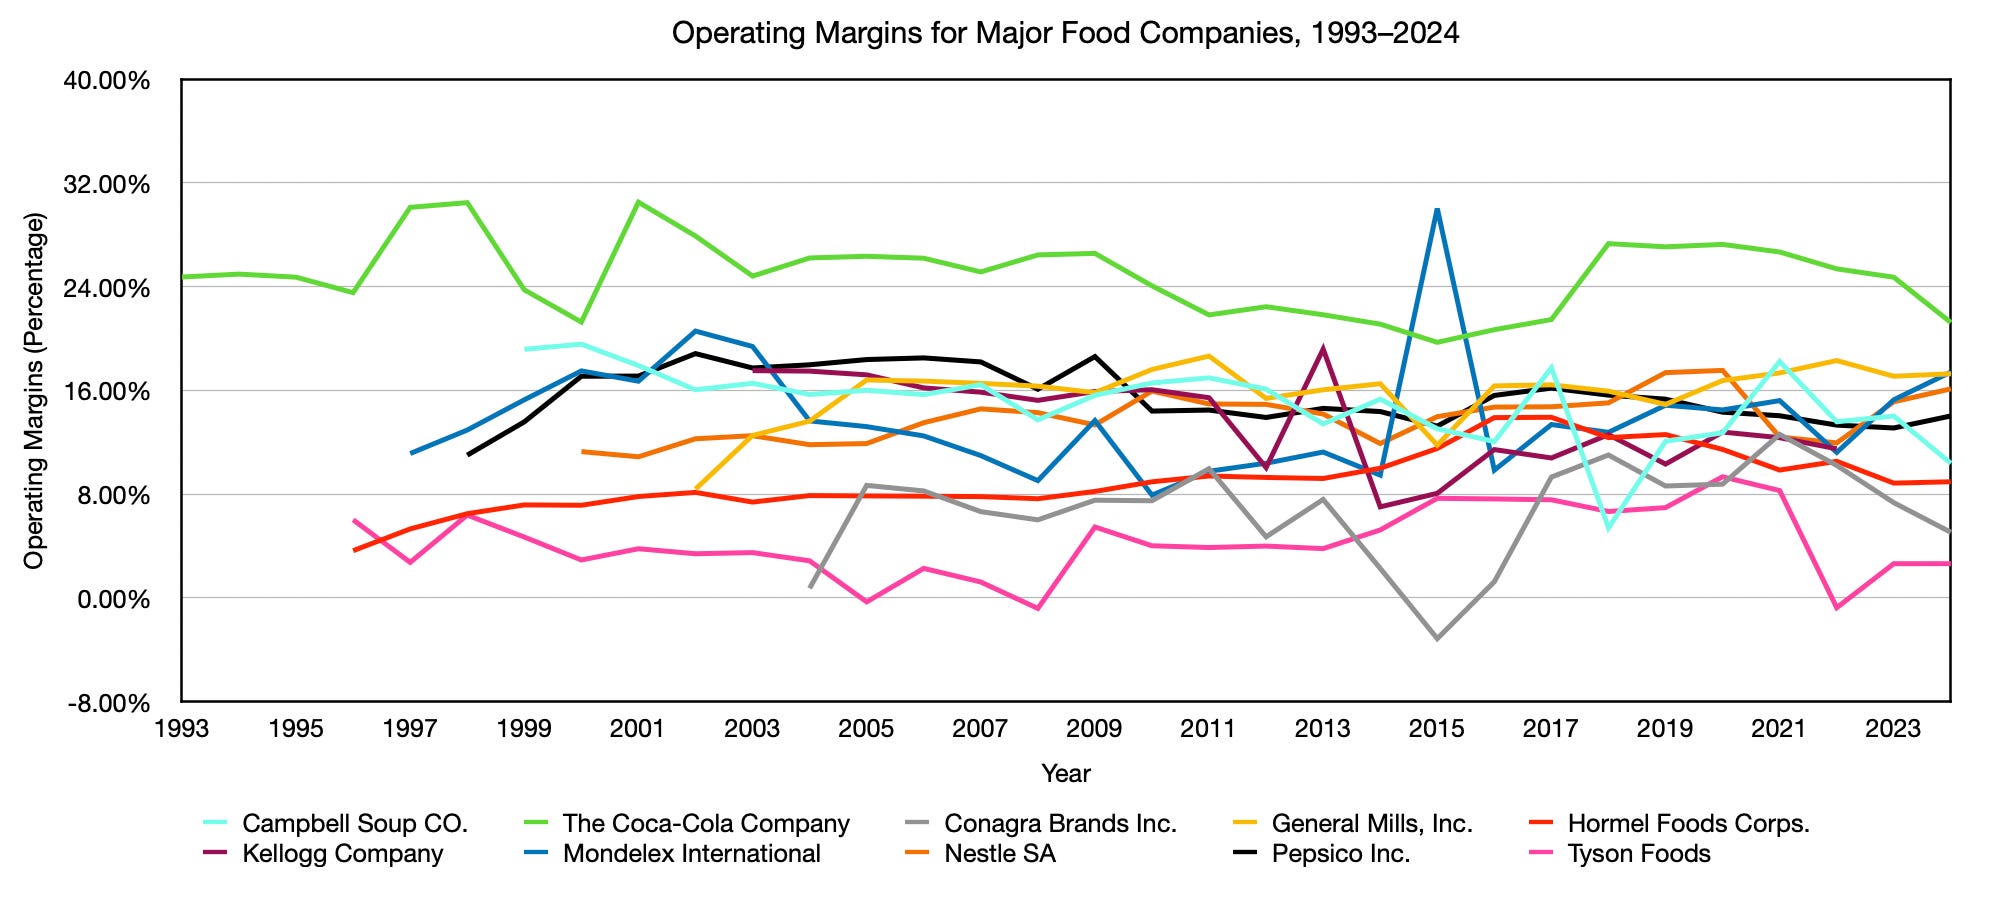
To check whether this is an isolated case or part of a broader pattern, we widen the lens to ten major food processing and producing corporations: The Coca‑Cola Company, PepsiCo, Nestlé, Mondelez International, General Mills, Conagra Brands, Campbell Soup Company, Hormel Foods, Tyson Foods, and the legacy Kellogg Company before its split into Kellanova and WK Kellogg Co. These companies feel omnipresent in the supermarket. Their brands fill shelves, coolers, and freezers, and it is easy to assume they collectively dominate the at‑home food market.
The revenue data tell a more nuanced story. In 2022, total at‑home food expenditure in the United States was roughly 1.02 trillion dollars, while the combined revenue of these ten corporations was about 375 billion dollars, around 37% of at‑home food spending. In the late 2000s, the same group accounted for just over half of at‑home food spending. Over time, their combined share has fallen from above 50% to below 40%, even as their products have remained highly visible. Some of this decline reflects spin-offs and corporate restructuring, but the direction of the trend is still informative: the group’s share of the at-home-food expense pie has been shrinking rather than expanding.
When we examine operating margins across these ten companies from the early 1990s through the mid-2020s, we see a pattern like Tyson’s. Each firm tends to operate within a stable profitability band. Margins rise and fall with commodity cycles, input cost shocks, and demand changes, but there is no broad, sustained upward break that would signal a long-running campaign to capture the missing savings from a century of productivity gains. If anything, the data look like normal business volatility, not the fingerprint of a structural shift in bargaining power strong enough to absorb a 50% system‑wide cost reduction.
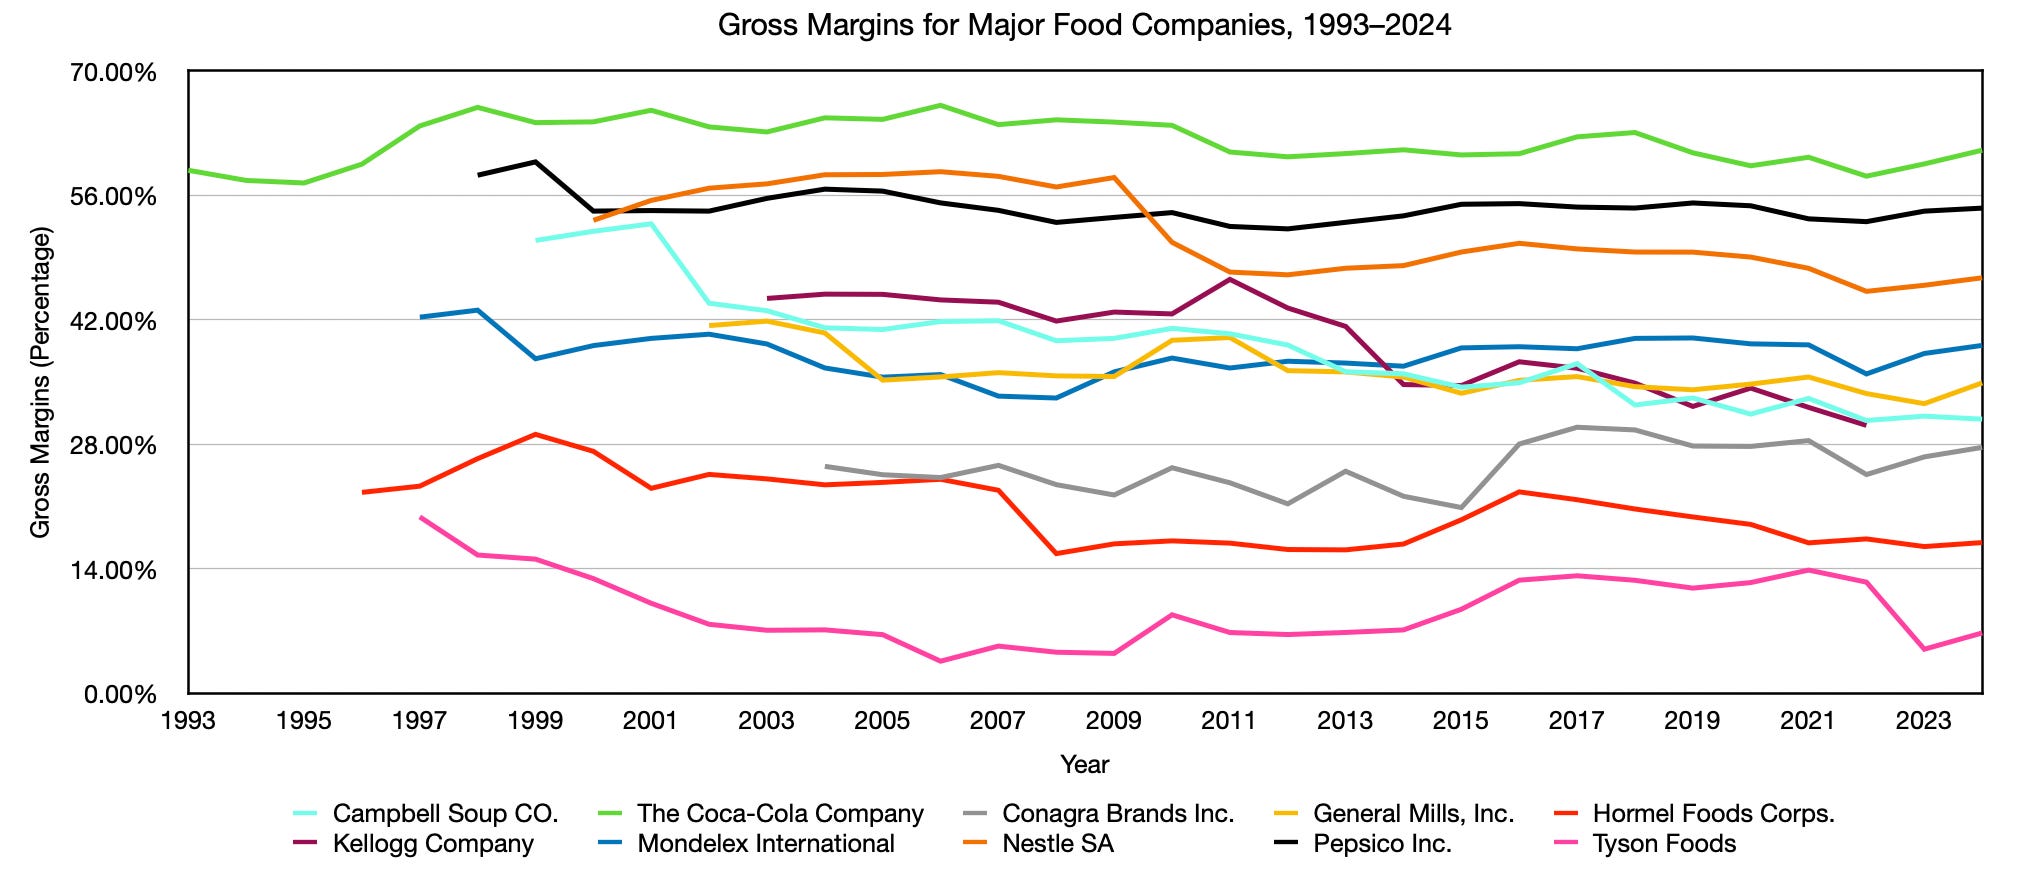
One common counterargument is that even if operating margins look stable, executives might be absorbing the cost savings through higher salaries, bonuses, and stock‑based compensation, so the gains never appear in operating income. To probe that concern, we can look at gross margins instead, the share of revenue left after paying for the cost of goods sold, before overhead and administrative expenses. Gross margin gives us a more direct sense of whether companies are paying less for inputs than they receive from customers.
Across this group of ten food companies, gross margins have generally not marched higher, and for many firms they have drifted down. That means it has become more expensive, not cheaper, to acquire the raw materials and intermediate goods needed to make their products, relative to the prices they can charge. If these companies were quietly harvesting large cost savings from lower production costs while using their market position to keep prices high, we would expect their gross margins to widen over time. Instead, the evidence points to input-cost pressures rather than to a hidden surplus being skimmed away.
Recapping the Case on Big Food Companies
Taken together, the financial records of the large food companies we have examined do not support the idea that they have captured a huge, unshared productivity dividend. We do not see operating margins breaking into a new, permanently higher range. We do not see the group’s share of at‑home food spending rising relentlessly. We do not see broad, sustained increases in gross margins that would signal a large spread between what companies pay suppliers and what they charge consumers.
None of this means market power and corporate behavior are irrelevant. Concentration can still harm specific groups, such as ranchers facing a small set of dominant buyers, and some corporate practices may well deserve regulatory scrutiny. What the evidence does show is that, in aggregate, corporate margins in the food sector do not explain why official price measures fail to reflect the full impact of long‑run productivity gains. The “corporate greed did it” story feels satisfying, but it does not resolve the central puzzle in this chapter.
In that sense, the corporate sector is a suspect we had to examine carefully. Once its financial statements are on the record, however, the case for treating it as the main culprit behind the missing food savings looks weak. If food is still more expensive than a century of innovation suggests it should be, the explanation lies deeper than the profit margins of brand‑name companies.
In the next part of this chapter, we turn to the dynamics of markets and consumers themselves and ask a different question: why do competitive pressure and household behavior make it extremely difficult for food corporations to keep prices elevated for long? While you are waiting for that section, it is worth reading “Why Food Has to Be Cheap for Everything Else to Exist,” which explains why food functions as a constant survival subscription and why keeping it affordable is essential for the rest of the economy to thrive.
Methods and Sources
Calculation for Food Inflation
Food inflation over 2020–2025 is calculated from the Consumer Price Index for All Urban Consumers: Food in the U.S. City Average (series CPIUFDSL), using the percentage change in the seasonally adjusted index from January 2020 to December 2025, as reported by FRED and the U.S. Bureau of Labor Statistics.
Gross and Operating Margin Calculations for Major Food Companies
All company-level revenue, cost of goods sold (COGS), and operating income figures used in the margin analysis are drawn directly from the annual reports and Form 10‑K filings of ten large food producers and processors: Campbell Soup Company, The Coca‑Cola Company, Conagra Brands Inc., General Mills, Inc., Hormel Foods Corporation, Kellogg Company (pre‑split legacy entity), Mondelez International, Nestlé S.A., PepsiCo, Inc., and Tyson Foods, Inc. For each firm and year, I record total revenue, COGS, and operating income as reported in the consolidated income statement, without adjusting for inflation, since margins are ratios rather than dollar levels.
Gross margin is calculated as (Revenue − COGS) ÷ Revenue × 100, using each company’s reported COGS (or equivalent “cost of sales” line where labels differ). Operating margin is calculated as Operating Income ÷ Revenue × 100, where operating income is the subtotal reported after production costs and operating expenses (selling, general and administrative, marketing, and R&D) but before interest, taxes, and one‑time items. In cases where firms undergo restructurings, spin‑offs, or changes in segment reporting (for example, the legacy Kellogg Company before its split, or Tyson corporate reorganization years), I retain the published totals for the consolidated entity in that year and note major structural breaks in the graph captions and endnotes rather than adjusting or splicing series.
Revenue Share of Major Food Companies in At-Home Food Spending
For each year from 2004–2022, I sum the nominal annual revenues of ten large publicly traded food and beverage companies (Campbell Soup Co., The Coca‑Cola Company, Conagra Brands Inc., General Mills, Inc., Hormel Foods Corp., Kellogg Company pre‑split, Mondelez International, Nestlé S.A., PepsiCo Inc., and Tyson Foods) using figures reported in their annual reports and Form 10‑K filings. I then divide this combined revenue total by nominal U.S. at-home food expenditures for the same year, as reported in the USDA Economic Research Service Food Expenditure Series, to obtain each year’s percentage share. Because both the numerator and denominator are in current dollars, no inflation adjustment is applied for this ratio; spin‑offs and restructurings (such as Conagra’s Lamb Weston spin‑off or Kellogg’s later split) are treated as structural breaks and noted in captions and endnotes rather than retroactively adjusted.
Sources
Campbell Soup Company. (1996–2025). Annual reports and financial publications. AnnualReports.com. Retrieved December 31, 2025, from https://www.annualreports.com/Company/campbell-soup-company
Coca-Cola Company. (1993–2024). Annual reports and Form 10-K filings. AnnualReports.com. Retrieved December 31, 2025, from https://www.annualreports.com/Company/coca-cola
Conagra Brands, Inc. (and predecessor Conagra Foods, Inc.). (2000–2025). Annual reports and Form 10-K filings. AnnualReports.com. Retrieved December 31, 2025, from https://www.annualreports.com/Company/conagra-brands-inc
Consumer Price Index for All Urban Consumers: Food in U.S. City Average [CPIUFDSL], retrieved from FRED, Federal Reserve Bank of St. Louis; https://fred.stlouisfed.org/series/CPIUFDSL, April 2, 2026.
General Mills, Inc. (2002–2024). Annual reports and financial publications. AnnualReports.com. Retrieved December 31, 2025, from https://www.annualreports.com/Company/general-mills-inc
Hormel Foods Corporation. (1996–2025). Annual reports and financial publications. AnnualReports.com. Retrieved December 31, 2025, from https://www.annualreports.com/Company/hormel-foods-corp
Mondelez International, Inc. (and predecessor Kraft Foods Inc.). (1997–2024). Annual Reports and Form 10-K Filings. Investor Relations Publications. Retrieved December 31, 2025, from https://www.mondelezinternational.com/investors/financials/annual-reports/. (Note: The 2001 Annual Report includes comparative financial data back to 1997; earlier years are from legacy Kraft Foods filings accessible via SEC EDGAR.)
Nestlé S.A. (2000–2024). Annual reports and financial publications. Nestlé Investor Relations. Retrieved December 31, 2025, from https://www.nestle.com/investors/publications
PepsiCo, Inc. (1998–2024). Form 10-K: Annual Reports for the fiscal years ended December 31, 1998 through 2024. U.S. Securities and Exchange Commission (EDGAR, CIK 0000077476). Retrieved December 31, 2025, from https://www.sec.gov/edgar/browse/?CIK=77476
Ryan, K. (October 5, 2024). This Infographic Shows How Only 10 Companies Own All The World’s Food Brands. Retrieved from https://www.good.is/this-infographic-shows-how-only-10-companies-own-all-the-worlds-food-brands/
Rechenberg, R. (November 3, 2025). Beef prices: Blame the Packers, Not American Ranchers. Retrieved January 1, 2026, from https://prosperousamerica.org/beef-prices-blame-the-packers-not-americas-ranchers/
Total At-Home Food Expenditures: U.S. Department of Agriculture, Economic Research Service. (2025). Nominal Food and Alcohol Expenditures, with Taxes and Tips, for All Purchasers, by Outlet Type [Excel spreadsheet]. Food Expenditure Series. Retrieved December 31, 2025, from https://www.ers.usda.gov/data-products/food-expenditure-series/ (data extracted from the “Nominal expenditures” sheet for food-at-home categories).
Tyson Foods, Inc. (1997–2025). Annual Reports and Form 10-K Filings. Investor Relations Publications. Retrieved December 31, 2025, from https://ir.tyson.com/reports/annual-reports/default.aspx.
U.S. Securities and Exchange Commission. Kellogg Company. (2001–2022). Form 10-K: Annual Reports for the fiscal years ended December 31, 2001 through 2022. Archived via EDGAR (CIK 0000055067). Retrieved December 31, 2025, from https://www.sec.gov/edgar/browse/?CIK=55067. Operating income and revenue figures extracted from the consolidated income statements in each annual filing. 2003-2022.
Author: Kyle Novack
April 3, 2026
A Monumental Venture, LLC: research project (Novack Equilibrium Theory – NETs)
Attribution Required: © 2025–2026 Kyle Novack / Monumental Venture, LLC. For educational use with credit; commercial use requires permission. Full details in linked PDFs.