
Close Enough to Trust, Wrong Enough to Matter
CPI Series Part 3


Rent is due on the first. Groceries cost more than they did last year. A paycheck either barely covers the month, or you’re scrambling to figure out how to reduce expenses just to balance the budget. Miss a debt payment, and your car gets repossessed. This is the thing that can completely upend your life if not handled correctly. Money doesn’t feel abstract; it feels like the most concrete force in daily life. However, what if that’s not true? What if the thing you’re working every day for, that you stress about at the end of every month, that can unravel everything if it slips, doesn’t really exist in any physical sense?
You’ve probably heard that the dollar has no intrinsic value. But what does that mean? It doesn’t mean your paycheck is fake. It means there’s nothing physical backing it up. No gold in a vault, no fixed quantity of anything you could point to and say, “that’s what this dollar represents.” A value exists entirely because it’s an exchange for value. It allows us to trade internal inputs to get outputs we wouldn’t be able to create ourselves. And through that dynamic, money itself acquires an associated value to facilitate trade between individuals.
Which is exactly what makes measuring it so hard. You are measuring a theoretical thing with real-world tools that were never quite designed for the task.
This is what Parts 1 and 2 were building toward. Part 1 laid the foundation, what the basket is, why it needs to be updated, how the weights work, and why the machinery behind that monthly number is far more complex than most people realize. Part 2 started pulling on a thread that led to the conclusion that money itself is a theoretical construct, and that measuring inflation may be closer to impossible than anyone in the field is comfortable admitting. This article is the payoff for engaging with Parts 1 and 2.
Given what money is, CPI does a genuinely remarkable job. So, here’s the question this article is asking: what happens if that’s true? What happens if the most important inflation measure in the world is doing its job well, and something is still systematically wrong?
To take that question seriously, we must clear the field first. There is no shortage of CPI critics, and some of their arguments are loud enough that they deserve a real answer before we move on. Because if any of the common critiques are right, if the weights are manipulated, if the basket is cherry-picked, if the methodology is quietly tilted, then the question changes entirely. So, let’s test them.
The Loudest CPI Critics Are Looking in the Wrong Place
To test the most common criticisms of CPI, all you need is simple logic and a little math, and the arguments start to fall apart on their own.
The most common criticism isn’t about what CPI measures. It’s about how much weight each category gets. Critics argue that housing is underweighted, that medical care doesn’t reflect reality. These are legitimate questions worth taking seriously. But the math that underlies them leads to a conclusion most critics don’t reach.
The weights are a closed system. Every percentage point you add to one category has to come from somewhere else. That constraint sounds simple, but its implications are significant.
To see what that means in practice, consider June 2022, the peak of the most significant inflation episode in forty years. We took every category that critics most commonly argue is underweighted: food, energy, shelter, transportation, and moved them up. Not arbitrarily. These are the categories that dominate people’s felt experience of inflation and are most frequently cited as evidence that CPI understates the true cost of living. We gave the critics exactly what they asked for.
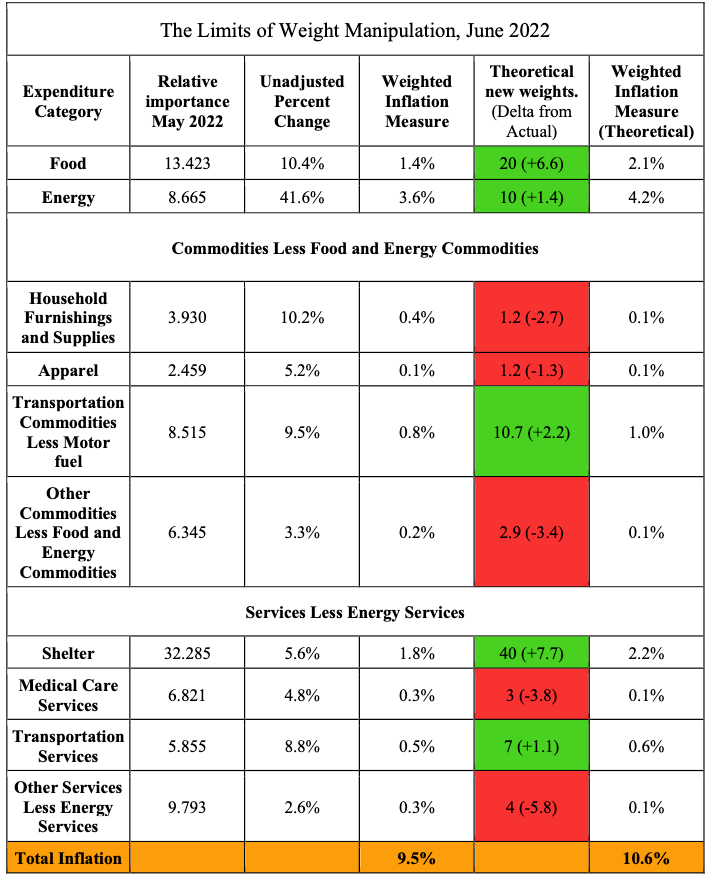
The result: 10.6% versus the actual weighted measure of 9.5%. A difference of 1.1 percentage points, at the absolute peak of a generational inflation event, with every high-inflation category deliberately shifted upward to reflect the most common criticisms of the index. That’s an 11.5% increase in the measured inflation rate under the most favorable conditions for the weight-manipulation argument.
If the weights can only move the needle 11.5% during the worst inflation episode in forty years, what happens during a normal period when category rates are compressed into a much tighter range? The answer is: even less. The gap between what the weights can produce and what critics claim they’re hiding continues to narrow.
The weights aren’t irrelevant. Getting them right matters at the category level, and the debates about housing and food representation are worth having. But closed-system mathematics means the weights simply cannot be the mechanism by which CPI systematically hides inflation in any meaningful way. You cannot get there from here, not even when you try as hard as the data allows.
Which raises the obvious next question: if not the weights, then where?
The Basket Itself
If the weights can’t move the needle enough to explain what people feel, the next logical place to look is the basket itself. Maybe the BLS is quietly selecting items that inflate less, tracking goods that don’t reflect what real people buy, and building a basket that systematically understates the true cost of living.
But this is where the critique runs into a wall it cannot get past.
The BLS isn’t pricing a handful of hand-selected items. It’s tracking prices across more than 200 categories of goods and services that Americans purchase, using data from the Consumer Expenditure Survey on how real households spend money. The basket is broad by design, and its breadth creates a problem for anyone arguing deliberate suppression: a broader basket means more inflation exposure, not less. If you wanted to build an index that reliably understated inflation, the last thing you would do is include 200 categories of goods and services where prices are rising. You would narrow it. You would identify the stable factors and measure them (U.S. Bureau of Labor Statistics, 2025).
The BLS did the opposite. Every category they add is another place where inflation can register. Every subcategory they track is another place where price increases show up in the index. The breadth that makes CPI good at catching economy-wide price pressure is the same breadth that makes systematic suppression through basket selection almost structurally impossible.
So the weights can’t do it. The basket selection can’t do it either. But that doesn’t mean we’ve run out of places to look. There are still legitimate methodological debates sitting between here and the real question, hedonic adjustments, and owners’ equivalent rent, that deserve an honest examination before we can say with confidence where a structural error could actually hide.
Why the Real Errors Don’t Add Up
The remaining critiques of CPI are more legitimate than the weight and basket arguments. Owners’ equivalent rent, hedonic adjustments, and substitution bias are real methodological debates among serious economists. The question isn’t whether they exist. It’s whether they add up to anything meaningful at the headline level.
I know this because I made the same mistake most people make when they first encounter these arguments. My initial assumption was straightforward: CPI has several well-documented sources of potential error. Housing measurement through owners’ equivalent rent arguably understates true housing costs. Hedonic adjustments for quality improvements reduce measured inflation, a point that reasonable economists debate. Substitution bias, the tendency of the index to be slow in reflecting how consumers shift spending when prices rise, introduces another potential downward pull. (As covered in Part 1, cross-category substitution isn’t permitted within CPI-U.) My instinct was to add them up. For example, if housing is off by roughly 2%, hedonic adjustments introduce another 2%, and substitution bias contributes another 2%, then the total error in CPI is somewhere around 6%. That seems like a coherent argument, but it is also wrong.
The mistake is in the addition itself. Each of those errors doesn’t apply to the entire index. Each one applies only to its own slice of the basket, and that slice gets weighted before it contributes to the headline number. Housing represents roughly 32.2% of the CPI basket. So even if owners’ equivalent rent is understating true housing inflation by 2%, the contribution of that error to the overall index isn’t 2%. It’s 2% multiplied by 32.2%, which is approximately 0.644%. Hedonic adjustments apply primarily to electronics and a handful of other technology-adjacent categories — a relatively small slice of the overall basket. And substitution bias, even if accepted at face value, faces the same constraint. Whatever error exists in either, it gets averaged through the same weighting structure before it reaches the headline, limiting its impact on the overall index.
When you do the math honestly, stacking every legitimate critique of CPI methodology at its most aggressive estimate and running it through the actual weights, you cannot get to a 6% headline error. The basket structure won’t allow it. The same breadth that prevents any single category from dominating the index also prevents any single category’s measurement error from dominating it. Localized errors get mathematically contained before they reach the surface.
This is also the fundamental flaw in the loudest alternative inflation measures. Without getting into specific names, the most prominent claims that true inflation runs 6 to 8 percentage points above the official figure rest on treating localized or one-time methodological adjustments as if they apply to the full index permanently. The math doesn’t hold. When economists have gone back and checked whether specific goods and services have increased in price at the rates those claims imply, the real-world prices don’t confirm it. The critique sounds compelling in the abstract. The grocery store doesn’t cooperate.
None of this means CPI is perfect. Owners’ equivalent rent involves genuine methodological debate. Hedonic adjustments are imprecise. These are real errors, meaningful at the category level, but contained by the basket structure at the headline level. They are not where a structural error of any significant magnitude could hide.
The localized errors can’t get there. The weights can’t do it. The basket can’t do it. Which leaves one remaining question: what if there’s a systemic force in the economy that is already suppressing prices before CPI starts measuring them? If that’s true, then by definition, what we’re measuring is not the real rate of inflation. And no refinement of the basket, the weights, or the methodology could ever catch it, because the force is already inside every number before measurement begins.
That question is what the next section is built on. And to understand why nobody asked it sooner, you must understand when CPI was built, and what didn’t exist yet when it was.
How the Right Question Got Lost
To understand why CPI possibly has a blind spot, you have to understand when it was built and what tools existed at the time.
CPI in its modern form was developed in the 1930s. The Great Depression had made measuring the cost of living an urgent national priority. Policymakers needed a reliable way to understand what was happening to household purchasing power in real time. The BLS built a framework that was remarkably sophisticated for its era and is still relatively intact today. For what it was designed to do with the knowledge available at the time, it was an extraordinary achievement (Rippy, 2014).
But here is the critical detail. When CPI’s modern framework was being built in the 1930s, productivity measurement existed, but only in the narrowest sense. The BLS had been publishing industry-specific labor productivity measures for manufacturing since the late 1800s, but these were too limited to say anything meaningful about the economy as a whole. The first significant publication of productivity measures for the full manufacturing sector didn’t arrive until 1955, going back to 1909, and expanded to the whole private economy in 1959. And even those were labor-productivity measures only, output per hour worked. They could tell you how much workers were producing per hour in a given industry. They could not tell you how efficiently the entire economy was converting all of its inputs into output, and they certainly could not tell you how those efficiency gains were flowing through the production system and arriving in final prices before CPI started measuring them. That tool, total factor productivity, didn’t exist until 1983. By that point, CPI had already been the foundational anchor of virtually every major economic decision in the country for decades. The measurement that would have made the question visible arrived long after the framework it needed to interrogate was already locked in place (U.S. Bureau of Labor Statistics, 2020).
Which means when CPI was being designed, nobody could have asked the question that sits at the heart of this critique. Not because they weren’t smart enough. Not because they weren’t rigorous enough. But because the measurement tools that would have made the question visible didn’t exist yet.
The two frameworks were developed separately because they had to. Productivity and inflation are expressed through entirely different data: one lives in physical quantities and efficiency ratios, the other in final prices and what the dollar buys. Two different measurements, two different methodologies, two different bodies of literature grew up around them. And somewhere in the decades of measuring them separately, something subtle happened. The practical necessity of measurement separation became a theoretical assumption of conceptual separation. Because the tools always treated them as distinct phenomena, mainstream economics gradually began to think of them as operating independently. The map became the territory.
In the real economy, there is no such separation. There never was. Every time a factory becomes more efficient, that efficiency cascades through the supply chain and shows up in the final price before CPI starts measuring. Every time agricultural yields improve, that improvement is already absorbed into food prices before the index records them. The productivity system and the monetary system run simultaneously, inseparably, through the same prices all the time. One pushes prices down. The other pushes prices up. CPI records the net result and calls it inflation. The two forces are never disentangled because the measurement infrastructure was never designed to do so.
And so the question of whether they needed to be disentangled gradually stopped being asked. Not because it was examined and found unimportant. But because productivity researchers talked to productivity researchers, and monetary economists talked to monetary economists, and nobody was stationed at the intersection where the question lived. The right question didn’t get lost because no one dropped it. It got lost because the structure of the disciplines meant it never had anyone to carry it.
This is not a story about incompetence or deliberate misdirection. It is a story about thousands of brilliant people working within the same framework, asking questions the tools could answer, and never having reason to question the foundation beneath them. By the time productivity measurement was sophisticated enough to ask what it was doing to inflation measurement, CPI was already embedded so deeply into the architecture of economic decision-making that the foundation felt immovable. Interest rates are calibrated against it. Wage negotiations are anchored to it. Pension adjustments tied to it. Policy built on top of it.
The problem was never the people. It was always the question that never got asked. And if that question turns out to have a real answer, if there is something systematically acting on prices before CPI starts measuring, then the implications don’t stay contained to the measurement. They cascade outward into every inflation-adjusted figure in the economy. Every real wage calculation. Every GDP figure. Every cost-of-living adjustment. Every policy decision calibrated against a number that was quietly, consistently measuring something slightly different than what it claimed to measure.
That is what Part 4 is for.
Next: If the common objections do not hold up, the real flaw must be somewhere else entirely. Continue to "The Silent Ghost That Distorted a Century of Measurement."
Method and Sources
Table The Limits of Weight Manipulation, June 2022
Data for this table are drawn from the U.S. Bureau of Labor Statistics Consumer Price Index report for June 2022, which used expenditure weights reflecting relative importance as of May 2022.
Categories are reported as published by the BLS with two exceptions. The “Other Commodities Less Food and Energy Commodities” category consolidates four BLS subcategories: medical care commodities, recreation commodities, education and communication commodities, and alcoholic beverages and other goods. The “Other Services Less Energy Services” category consolidates three BLS subcategories: recreation services, education and communication services, and other personal services.
For each consolidated category, the weighted inflation measure was calculated by multiplying the relative importance of each constituent subcategory by its BLS-reported unadjusted percent change, then summing those products across the subcategories. The unadjusted percent change for each consolidated category was then derived by dividing the resulting weighted inflation measure by the combined relative importance of that category.
The actual relative importance weights used in this table sum to 98.091 rather than 100. This reflects standard BLS reporting practice, the remaining weight is distributed across smaller subcategories not separately reported in the headline release. The theoretical new weights were normalized to a total of 100 to allow for a clean comparison and to reflect how a fully specified alternative basket would be structured. Weighted inflation measures for the theoretical basket were calculated using the same methodology applied to the actual weights.
Sources
Rippy, D. (2014, April). The first hundred years of the Consumer Price Index: A methodological and political history. Monthly Labor Review. U.S. Bureau of Labor Statistics. https://www.bls.gov/opub/mlr/2014/article/the-first-hundred-years-of-the-consumer-price-index.htm
U.S. Bureau of Labor Statistics. (2022, July 13). Consumer price index — June 2022 [Press release]. https://www.bls.gov/news.release/archives/cpi_07132022.htm
U.S. Bureau of Labor Statistics. (2025, January 30). Consumer price index: Overview (Handbook of Methods). U.S. Department of Labor. https://www.bls.gov/opub/hom/cpi/home.htm
U.S. Bureau of Labor Statistics. (2020, September 23). History of the BLS productivity program. Office of Productivity and Technology. https://www.bls.gov/opub/hom/msp/history.htm
Author: Kyle Novack
May 12, 2026
A Monumental Venture, LLC: research project (Novack Equilibrium Theory – NETs)
Attribution Required: © 2025–2026 Kyle Novack / Monumental Venture, LLC. For educational use with credit; commercial use requires permission. Full details in linked PDFs.