
Economics Made Simple: Why Your Household Budget Explains Everything
Nets Primer: Part 1 – How “Corporation You” exposes broken economic stats


Economics has been given a bad name. It’s wrapped in jargon and PhD models, so it feels like something only “experts” can understand. But here’s the truth: if you can run a household with mild effectiveness, you already understand more economics than most experts are willing to admit.
Every month, you decide what to do with limited income—rent or a nicer car, groceries or eating out, save or spend now. That’s all economics is: making trade-offs with scarce resources. “Corporation You” is a microeconomy, and the same logic scales up to entire nations.
The household as a mini‑economy
Think about your home. You:
Allocate money to rent, food, transportation, utilities, and a little fun.
Feel the consequences when you misjudge—skip laundry, and suddenly you’re out of clean clothes; misjudge the budget, and a car repair wrecks your month.
An economy is just millions of those households plus businesses and governments, all doing the same thing at larger scale. When something “slides” in one area—like housing costs or healthcare—you get cascading effects everywhere else.
The key point: if the numbers on the news don’t match what your own budget is screaming, that’s not because you “don’t get economics.” It might be because the way we measure the big economy is off.
The inflation fog over your budget
Our main tool for comparing today’s economy to the past is an index called CPI, the Consumer Price Index. It’s what gets used to say things like “inflation was 3% this year” or “your wages went up more than prices.”
If CPI is even a little wrong, everything built on top of it is distorted:
Historical comparisons (“you’re better off than your parents”).
Real wages (“workers are doing great”).
Policy decisions (“we don’t need to raise pay; it’s already at record levels”).
In later posts, I’ll go deep into the 1.5% measurement error I believe is baked into CPI. For now, just hold this idea:
If your household feels squeezed while official data says you’re thriving, the issue might not be you—it might be the ruler they’re using.
The automation paradox: when cheaper doesn’t look cheaper
Take a simple story. A factory invests in automation, cutting its production costs by 20%. On paper, that should eventually mean lower prices or better products for the same price. That’s the promise of technology and competition.
In the short run, everyone agrees this is good:
Lower unit costs.
Stronger profits.
Room to cut prices or offer more value.
But in the long run, we look at the data and see something strange: prices appear to keep going up, even for goods that have become much cheaper to produce. Grocery bills rise. Electronics get “better” but not obviously cheaper. The average person reasonably concludes:
“Companies pocket the savings and blame inflation.”
“Competition isn’t working.”
Here’s the catch: when you’re measuring prices with a distorted inflation index, real cost savings get buried. The fundamentals of competitive markets and productivity still work. It’s our measurement that makes us feel like they don’t.
The iPhone and the grocery bill
Take the iPhone. Early models carried very high gross margins. Today’s iPhones are vastly more powerful, sold in a far more competitive market, and Apple accepts thinner margins on each device. That’s what real-world productivity and competition look like: more capability for each dollar, even if it doesn’t always show up as a lower sticker price.
That’s what you should expect:
Innovation drives productivity.
Productivity allows more value per dollar.
Competition forces companies to share some of that gain with customers.
Food tells a similar story, but with a twist.
Decades ago, food often took 27–32% of a typical family’s budget.
Today, it’s more like 16–21% for many households.
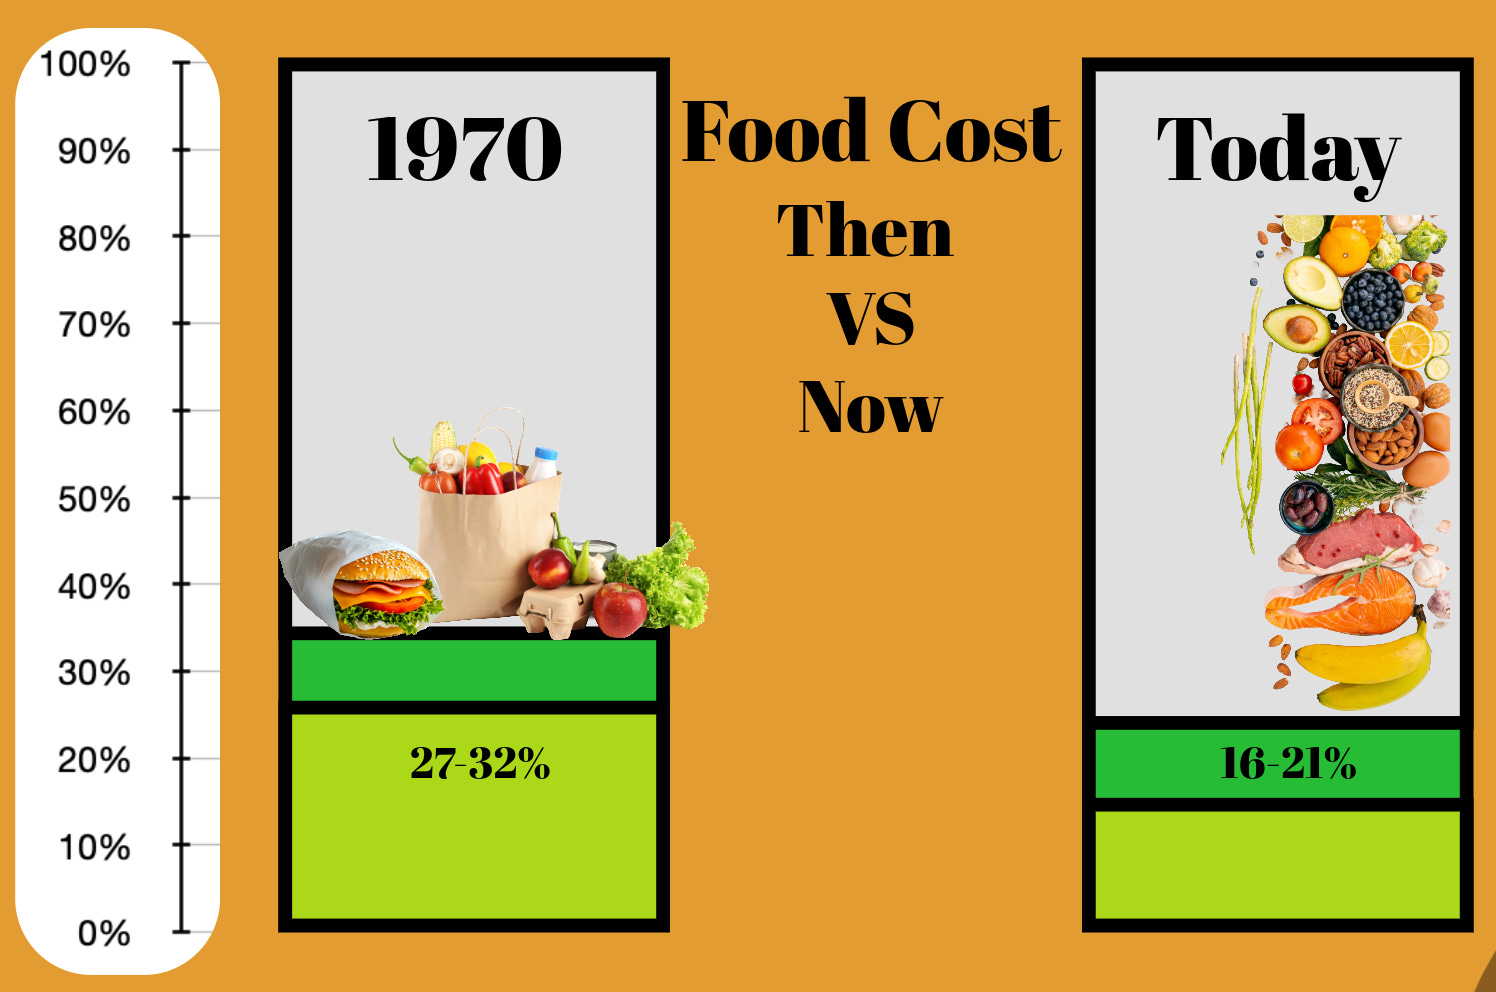
On paper, that sounds like a win. But when you stand in the store staring at $6–$8 beef and rising grocery totals, you don’t feel like food is cheaper. The truth is:
Food’s share of income has fallen.
It hasn’t fallen as much as it should have, given how dramatically farm productivity has improved and supply chains have advanced.
The missing savings—the part that never shows up in your cart—is what I later call “shadow inflation”: the hidden gap between what technology should have delivered and what your paycheck buys.
The value gap: why you feel underpaid
This is where most people feel the pain most directly.
You pour value into the system—skills, time, late nights, and emotional bandwidth.
You look at your pay and your bills and think: “This doesn’t line up. I’m missing something.”
It’s tempting to blame only “greedy corporations” or “lazy workers,” depending on your politics. But there’s a quieter culprit:
For decades, decision‑makers have been looking at distorted metrics and drawing the wrong conclusions.
If CPI tells them inflation is low, and wages are at “record highs,” why would they feel pressure to raise pay further? Based on the official story, they think they’ve kept up their end of the bargain.
Under a corrected lens, the picture changes. By my calculations:
Median household income today should be around $110,000, not the current ~$83,730.
That’s roughly $26,270 per year missing from the typical household.

At the household level, that means:
Every four years, you effectively lose a full year of income compared to where you should be.
The middle-class lifestyle people remember from the 1970s—one income, a house, kids, and a vacation now and then—would be far more attainable if that gap weren’t there.
The fundamentals of economics haven’t failed you. Measurement has.
Bringing it back to “Corporation You”
When you run your household, you:
Track income and expenses.
Feel the impact of misjudged costs.
See directly whether your standard of living is rising, flat, or falling.
Macroeconomic statistics are supposed to be the zoomed-out version of that reality. But if the measuring stick is warped, the picture gets fuzzy—and people stop trusting it.
The core argument of NETs is not that competition or productivity is broken. It’s that:
You were never crazy to feel squeezed.
The cost‑of‑living crunch is real, not imagined.
The main flaw lies in how we’ve been measuring inflation and value over time.
If you can understand a household budget, you can understand the economy well enough to see through bad numbers. In the next post, I’ll go “back to basics” on land, labor, capital, and entrepreneurship—and explain why human time is the real denominator behind everything.
Next: If your household budget already runs on this logic, the next question is why the official numbers do not seem to agree with it. Continue to "When the Numbers Gaslight You: The Felt vs. Measured Economy."
Author: Kyle Novack
March 8, 2026
A Monumental Venture, LLC: research project (Novack Equilibrium Theory – NETs)
Attribution Required: © 2025–2026 Kyle Novack / Monumental Venture, LLC. For educational use with credit; commercial use requires permission. Full details in linked PDFs.