
How Regulation Touches, But Doesn’t Explain, Food Prices
Food Puzzle: Part 9

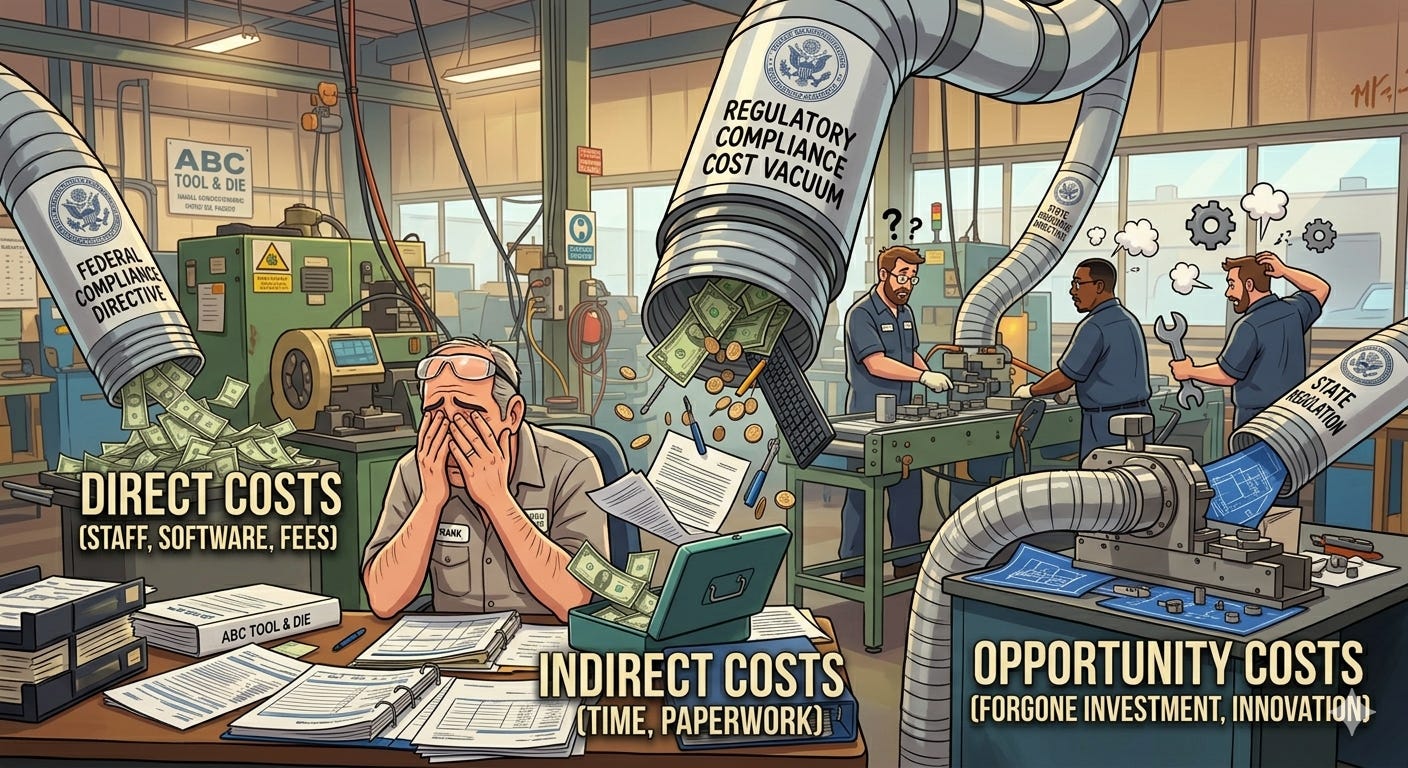
The last major suspect we can examine before questioning the measuring system itself is regulation. No one disputes that rules and compliance requirements add cost to doing business. The narrower question is whether those burdens are big enough, and structured in the right way, to absorb the massive cost savings that agricultural and supply‑chain productivity should have delivered. Regulation, please step onto the witness stand.
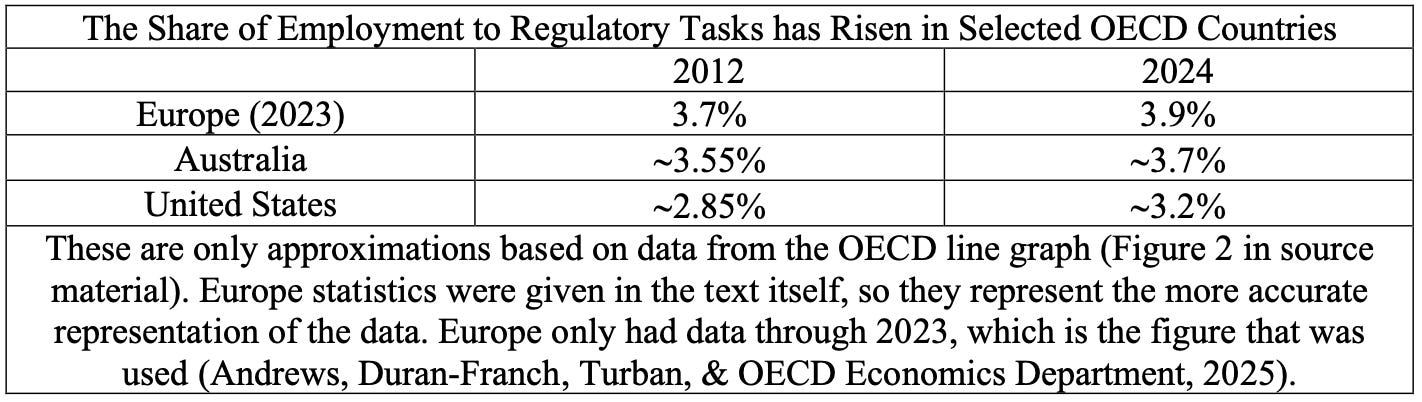
Recent work by the Organization for Economic Co-operation and Development (OECD) shows just how heavily businesses feel this load. In its Simplifying for Success survey, business organizations across member countries report that regulatory requirements and compliance now rank as their single most significant challenge. It was found to be ahead of challenges related to finding workers with the right skills, tax pressure, or geopolitical risk, and that this burden has been mounting over time. Yet when the OECD digs into the numbers, it finds that the share of employment devoted to regulatory tasks, compliance, reporting, and related functions, has indeed risen, but only modestly, in the economies it tracks (Andrews, Duran-Franch, Turban, & OECD Economics Department, 2025).
What the Data Say About Compliance Burdens
Approximate estimates from that work suggest that between 2012 and 2024, the share of jobs tied to regulatory tasks rose from about 3.7% to 3.9% in Europe (with data to 2023), from roughly 3.55% to 3.7% in Australia, and from around 2.85% to 3.2% in the United States. Those increases are meaningful at the firm level. They represent real people and hours being diverted into non‑production work, but when set against the scale of long‑run productivity growth in sectors like agriculture, they are relatively small. That contrast becomes clearer when we look at how economists measure productivity using Total Factor Productivity (TFP). Increases in compliance staff, reporting, and monitoring appear as higher measured labor and capital inputs in the denominator, rather than as unrecorded costs outside the system. (Andrews, Duran-Franch, Turban, & OECD Economics Department, 2025).
How Regulation Shows Up in TFP
To see why, it helps to be clear about how TFP is measured. Total Factor Productivity is calculated as total output divided by a quality-adjusted index of all inputs, including labor, capital, land, and materials. Regulations affect both sides of that ratio. Compliance requirements that add staff, monitoring equipment, or paperwork increase measured inputs, lowering TFP from the denominator side. Rules that restrict what can be produced from a given bundle of inputs lower the measured output, thereby reducing TFP from the numerator side. In both cases, any positive TFP growth we still observe is already net of regulatory drag, not evidence that regulation somehow “used up” the productivity gains (Wang, Nehring, Mosheim, & Njuki, 2024; USDA Economic Research Service, n.d.).
That is exactly what the historical record shows for U.S. agriculture. From 1948 to 2021, agricultural TFP still grew about 1.49% per year even as regulatory burdens increased, and farm output nearly tripled while measured inputs were flat or declined. Whatever costs regulation imposed are already baked into those TFP figures; the productivity dividend the Food Puzzle works with is a post‑regulation reality, not a pre‑regulation fantasy.
A Concrete Test: FSMA and Crop‑Sector TFP
A concrete example helps make this more tangible. The Food Safety Modernization Act (FSMA) of 2011 tightened standards to reduce the risk of foodborne illness, especially for produce growers, and clearly raised costs. Studies estimate that FSMA increased compliance costs by roughly 0.9% to 6–7% of annual sales for small and very small farms, and by about 0.3% to 0.9% for larger operations, numbers that are not trivial for individual businesses. Yet in the decade following FSMA’s implementation, crop‑sector TFP still grew at an average of around 1.2% per year as yields and overall output continued to rise. That rate is lower than the longer‑run average of about 1.5%, which is exactly what we would expect if regulation acts as a drag on measured productivity, yet it still falls far short of erasing the underlying gains (Bovay, Ferrier, & Zhen, 2018, & USDA Economic Research Service, 2025).
Why Regulation Cannot Resolve the Food Puzzle
This matters for the Food Puzzle because when we talk about the cost savings implied by productivity growth, those gains are at least partly net of regulatory burden. Agricultural TFP has continued to rise even as rules have tightened and compliance costs have increased, which suggests that, all else equal, correctly measured real food prices should show a clearer downward drift over time than we currently see in CPI‑adjusted data. The fact that CPI‑adjusted food prices mostly flatten or edge down only slightly is therefore not strong evidence that regulations fully absorbed the savings. Instead, it points to a gap in how we translate physical and cost realities into the price index. Put differently, regulations certainly raise costs for farms and food companies at any given moment, but many of those costs already appear in measured inputs, and TFP has nonetheless risen strongly. The long‑run productivity dividend traced throughout this series should be treated as a conservative, after‑regulation figure rather than a pre‑regulation ideal.
That is why, having carefully examined regulations, we must reject them as the missing piece of the Food Puzzle. They matter, but they do not bridge the gap between what the physical and cost data imply food should cost and what CPI says it does cost. Regulation, you are dismissed from the witness stand.
Where the Evidence Now Points
By this point in the Food Puzzle, we have put a long list of suspects on the stand.
On the farm side, we tested whether the savings were hiding in farm wages, capital costs, total production expenses, or higher farm profit margins, and found that none of these could absorb more than a fraction of the productivity gains.
In the supply chain, we examined packaging, transportation, labor, and the farm share of the food dollar, and found flat or falling real per‑capita costs and rising productivity, not an explosion of middleman markup.
We then turned to corporate behavior, showing that major food companies’ operating and gross margins, and their share of at‑home food spending, do not display the kind of sustained break you would expect if they had quietly captured the missing savings.
We looked at market dynamics and consumer behavior and found that the combination of high functional utility, recurring purchases, and easy substitution makes it extremely hard to keep food prices far above competitive levels for long.
We examined external shocks: pandemics, wars, droughts, energy spikes, and found that while they cause sharp but temporary price surges, per capita availability of key crops and calories has continued to rise, with prices reverting after the shocks rather than remaining permanently high.
Finally, we called regulation to the stand and saw that, while compliance burdens are real and do show up in measured inputs, the available evidence suggests they are too small to account for the full dividend implied by long‑run TFP growth.
Taken together, the evidence from farms, supply chains, corporate margins, consumer behavior, shocks, and regulations all points in the same direction: the physical and economic reality of food has become far cheaper to produce and distribute than our official price indexes are willing to admit. If the goods are simpler, the data cleaner, the productivity gains larger, and the competitive pressures stronger than in almost any other sector, and we still cannot see the full savings in CPI‑adjusted prices, then the problem is not the food system. It is the yardstick. With all the obvious suspects now cleared, it is time to call the ambiguous suspect, the measurement instrument itself, to the witness stand. This is required to determine how a systematic blind spot in CPI has quietly distorted our view of inflation, wages, and the dollar’s true value for more than a century. A task we turn to in the next article when we examine the measurement system itself.
Next: Every physical suspect has now been dismissed. That leaves one place left to look. Continue to "CPI at Odds with the Food Economy."
Sources
Andrews, D, Duran-Franch, J, Turban, S, & OECD Economics Department. (December 16, 2025) Time for a Regulatory Reset? Clearing the path for productivity and Dynamism. Retrieved January 4, 2026, from https://oecdecoscope.blog/2025/12/16/time-for-a-regulatory-reset-clearing-the-path-for-productivity-and-dynamism/
Bovay, J., Ferrier, P., & Zhen, C. (2018). Estimated costs for fruit and vegetable producers to comply with the Food Safety Modernization Act’s Produce Rule (EIB-195). U.S. Department of Agriculture, Economic Research Service.
Wang, S. L., Nehring, R., Mosheim, R., & Njuki, E. (2024). Measurement of output, inputs, and total factor productivity in U.S. agricultural productivity accounts (Report No. TB-1966). U.S. Department of Agriculture, Economic Research Service.
U.S. Department of Agriculture, Economic Research Service. (n.d.). Agricultural productivity in the U.S.: Summary of recent findings. Retrieved March 14, 2026, from https://www.ers.usda.gov/data-products/agricultural-productivity-in-the-united-states/summary-of-recent-findings