

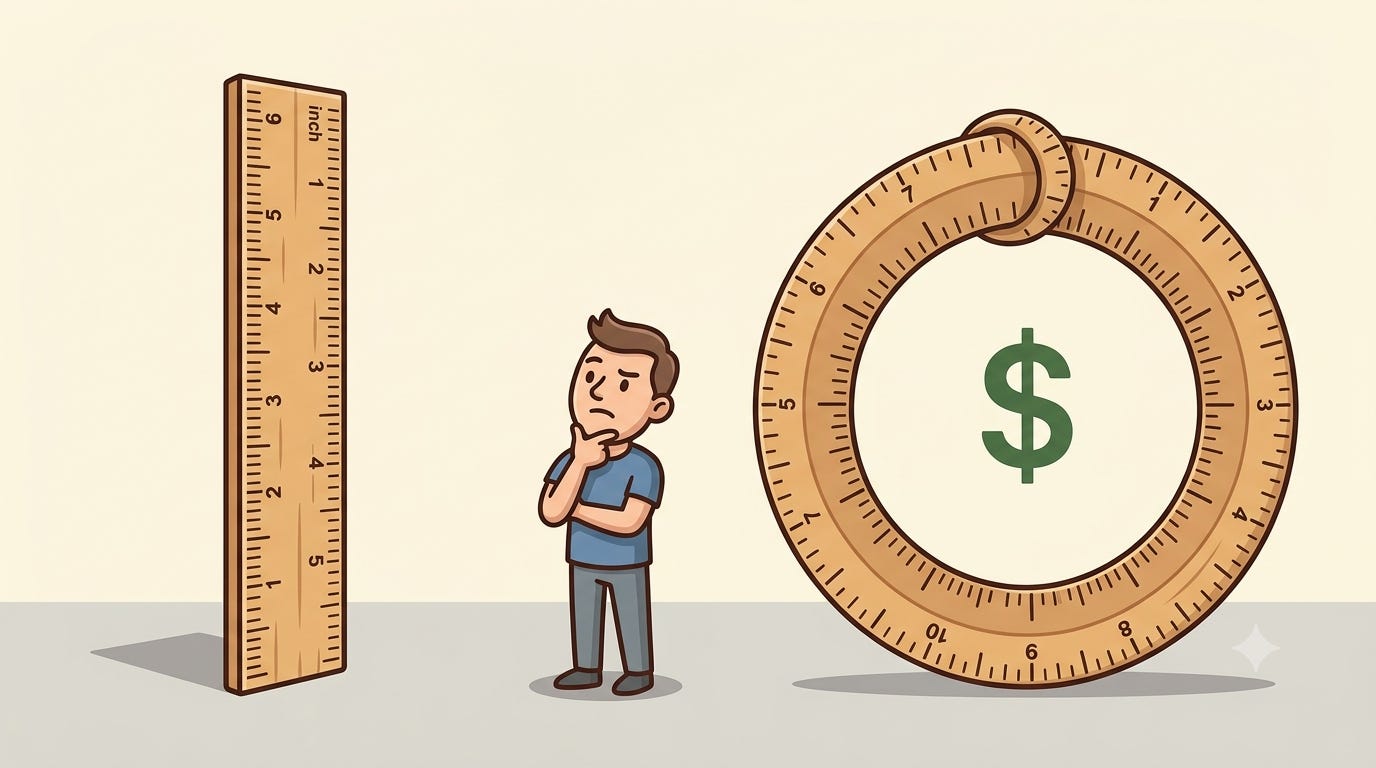
Everyone has felt it. A paycheck that used to stretch through the month now runs dry a week early. A grocery bill that seems to climb every time you look at it. A sense that something has shifted, even when the headlines insist the economy is fine. That feeling is not confusion. It’s data. The problem is that turning a feeling into proof is one of the hardest things you can attempt to do, and almost nobody tells you why before you try.
Here is what makes this field different from almost anything else I have ever tried to learn. Physics and chemistry are hard too, but once a unit is set, it holds still. An inch does not quietly stretch over a decade. A pound does not lose weight while nobody is watching. Even the units that have been redefined, the meter is now pinned to the speed of light, the kilogram to a fundamental constant in physics, were redefined so the calculation always returns the same answer (1). Run it today. Run it in a hundred years. You get the same meter that anyone can verify.
Economics has no such ruler. The dollar is not tied to anything outside the system of prices it is used to measure. It is worth exactly what it can currently be exchanged for, no more, no less, and that number is set by the market itself, not fixed by decree. Try it yourself: describe what a $20 bill is worth without describing what it can buy. You cannot get more than a sentence in before you are back to referencing prices, which is the whole problem. The tool we use to measure prices has no definition that does not already depend on prices. So when someone asks whether inflation is really 3% or 5% or something else entirely, they are not asking for a better calculation. They are asking a system to measure itself with the same tool that is doing the drifting.
That is the part that gets lost, and it is the actual reason this field feels impossible even to people who are good with numbers. The human truths underneath economics do hold still. If a good becomes far more abundant, its price tends to fall. If people get paid the same while producing more, that extra value must land somewhere. Those relationships do not drift.
What drifts is the ruler we use to prove them: the basket of goods, the price index, the definition of the dollar itself, all of it built by people making choices, none of it as fixed as a meter or a kilogram. Here is the double-edged part. We measure prices to find out how much value the dollar is losing. But those same prices are also moving for reasons that have nothing to do with the dollar: abundance, scarcity, productivity, doing exactly what they are supposed to do. A single price cannot tell you which force moved it. The truths hold still. The proof drifts. That is the entire difficulty of this field, in two sentences.
The complexity is real, not imagined
The dollar makes the case most directly, and the history is worth walking through. Before 1971, it was pegged to gold, $35 an ounce, an anchor you could check a price against, however imperfectly. Every other major currency was pegged to the dollar under Bretton Woods, which meant the entire global system was resting on that one peg. In August 1971, Nixon closed the gold window, and the structure built on top of it did not hold either. A patched-together agreement to fix currency exchange rates without gold collapsed just over a year after being signed. By 1973, the major currencies were floating freely. That closed the last external anchor for the dollar, and everything tethered to it. From that point forward, every question about what inflation really is must be answered from inside the very system of prices it is trying to measure (2 & 3).
On top of this, the gold anchor was already softer than it looked, long before 1971 closed it for good. For most of that stretch, people treated the peg as if it settled the question of what a dollar was worth. It didn’t. The Consumer Price Index moved from about 13.4 in 1934 to roughly 40.5 by 1971; prices roughly tripled, an increase of about 202%. The whole time the peg sat there unmoved, doing nothing to stop it. An anchor that lets the thing tied to it drift that far is not really an anchor. It is a suggestion. And in 1971, we let go of the suggestion too (4).
It gets harder from there. A price index must combine thousands of different goods: milk, rent, a haircut, and a laptop, into one number, and those goods do not move in price at the same rate. Deflate an industry’s output using the wrong basket, say a manufacturing company’s revenue using a consumer price index instead of an industry-specific one, and you can make genuine productivity gains look like stagnation, or make stagnation look like growth. I side with a single index for a specific reason: it is the only way to compare one industry against another on the same yardstick, manufacturing’s shrinking share of GDP for example, and see whether the story holds together. Industry-specific deflators solve one problem and reintroduce another. You gain accuracy within a sector and lose any ability to compare across sectors at all. Choose to compare wages against productivity using two different price indexes, one for output and one for paychecks, and the size of the gap you find depends heavily on that choice, a debate real economists have had in public and in print, for years.
One of these disputes never actually got resolved. It just stopped being argued about out loud. In the 1950s and 60s, economists at Cambridge, England, and Cambridge, Massachusetts, fought for two decades over a single question: can you measure ‘capital’ without first knowing the prices that only make sense once you already know the value of capital? The answer, conceded even by the side that lost the argument, was no. Not fully. The same circularity shows up anywhere you try to boil down a pile of different things: cars, wheat, and hours of human labor, into one clean number. You can’t add a car to a bushel of wheat without a price to weigh them by, and the price you’d use is often exactly the thing in dispute (5).
Layer on top of that the fact that a single price movement can point to two entirely different causes. A product’s price rising 5% could mean the real cost of making it went up: pricier materials, a labor shortage, a supply disruption. Or it could mean the currency used to buy it lost 5% of its value while the actual cost of production never moved. Both produce the identical observable number. Untangling which one happened, in any specific case, usually requires pulling records that were never designed to answer that question: farm-to-retail price spreads, pupil-teacher ratios, cattle herd cycles, corn yields per acre going back a century. That data exists. Finding it, and reading it correctly, is real, slow, unglamorous work.
There is a version of this that cuts deeper, and it can happen even when both causes are acting at once instead of one or the other. When output per hour rises, when a process gets more efficient, that puts real, downward pressure on a price. When the currency backing that price is losing value, that puts upward pressure on the same price, at the same time. What shows up in the data is not either force on its own. It is whatever survives after the two have already been netted against each other, before anyone gets the chance to look at them separately. A currency could be losing value quickly while productivity is cutting costs even faster, and the price you would observe would look calm, maybe even falling, while both things are happening underneath it in full force.
None of this is a flaw in the field. It’s the actual shape of the problem. The physical world underneath the economy, the land, the labor, the yields, the hours worked, can be measured directly, and none of it needs an outside reference point to hold still while you measure it. What has no outside reference point is the layer connecting that physical reality to a dollar value, and we already met this exact problem once, back when we asked what a $20 bill is worth without describing what it buys. Physical data narrows the question. It does not close it. Knowing how much wheat a farmer grew in 1980 and how much labor it took tells you a great deal, but it does not, by itself, tell you what that wheat should have cost in today’s dollars. Something still must bridge the physical measurement to the price, and that bridge is the same missing anchor this piece keeps running into. Anyone who tells you it’s simple to prove, in either direction, is skipping a step.
Simple to feel. Still hard to prove.
Here is the reality. If you’re trying to add new mechanisms and ideas to the field of economics itself, it really is as hard as it feels. We just spent a whole section proving that. But the core of what makes up an economy was never locked away in that layer. It is part of your daily life, whether you have a degree or not, and you already understand more of it, and more of the principles holding it together, than you give yourself credit for.
You already met two of these ideas in the introduction and nodded along with them. One is that goods are getting more abundant and their price is falling. Another is a person producing more while getting paid the same: the value must go somewhere. Nobody needed a degree to follow either one. Everybody also understands, without ever being taught it, that a fixed salary buys less if the specific things you need, a home, health care, and so on are getting expensive faster than everything else, even if your paycheck can technically buy the same amount of stuff on average. These are not technical insights. They are things people already navigate every week, with their own budgets, without ever needing to see a deflator formula.
The complexity is testing whether those ideas actually hold: whether the number in front of you is showing the mechanism you believe is true, whether the economy is actually moving in the direction that mechanism predicts, or whether a different mechanism is wearing the same number, the same trap this piece already ran into once, a price moving for one reason and a price moving for an entirely different one, landing on an identical figure. And unlike a meter or a kilogram, there is no fixed unit here to check your work against. You can run the number as many times as you want. It will never tell you, on its own, which mechanism it came from.
That’s the actual, honest relationship between the two halves of this. The intuition is not naive just because it’s simple. It’s simple because it’s close to something true. The complexity is not proof that the intuition is wrong. It’s the cost of trying to attach a precise, defensible number to something everyone can already feel. Most bad economic communication comes from collapsing that distinction, treating a felt intuition as if it were already a proven number, or treating a technical rebuttal as if it had disproven the feeling underneath it, when usually it has only shown that one way of measuring it didn’t hold up.
Hold both at once. The truths hold still, the ones you already understood without a degree, before this piece ever told you so. The proof drifts: through a currency with no anchor to check it against, through a hundred years of index choices, through two forces netting against each other before you ever get to see either one alone.
One person’s sense that something isn’t adding up could be noise. But tell enough people their wages are up, so they must just be spending badly, and watch how many of them don’t believe you. Not because they read the CPI report, but because they balance a budget every week and the math in front of them doesn’t match the math you’re handing back. A feeling like that, repeated across millions of households that have never spoken to each other, is not proof. It is not the destination. But it is data too, and it gets harder to file as noise the more of it shows up in the same place.
Feelings point the direction. Data confirms the destination. Neither one does the other’s job.
Reference
National Institute of Standards and Technology (NIST). 2019. “Kilogram: The Future.” U.S. Department of Commerce. https://www.nist.gov/si-redefinition/kilogram/kilogram-future
Bundesbank. 2023. “1973: The End of Bretton Woods. When Exchange Rates Learned to Float.” Deutsche Bundesbank, September 22, 2023. https://www.bundesbank.de/en/tasks/topics/1973-the-end-of-bretton-woods-when-exchange-rates-learned-to-float-666280
Federal Reserve History. 2013. “The Smithsonian Agreement.” Federal Reserve Bank. https://www.federalreservehistory.org/essays/smithsonian-agreement
U.S. Bureau of Labor Statistics. n.d. “Historical Consumer Price Index for All Urban Consumers (CPI-U): U.S. City Average, All Items.” U.S. Department of Labor. https://www.bls.gov/cpi/tables/historical-cpi-u-201710.pdf
Cohen, Avi J., and G. C. Harcourt. 2003. “Retrospectives: Whatever Happened to the Cambridge Capital Theory Controversies?” Journal of Economic Perspectives 17 (1): 199–214. https://doi.org/10.1257/089533003321165010
Author: Kyle Novack
July 28, 2026
A Monumental Venture, LLC: research project (Novack Equilibrium Theory – NETs)
Attribution Required: © 2025–2026 Kyle Novack / Monumental Venture, LLC. For educational use with credit; commercial use requires permission. Full details in linked PDFs.