


Ask someone why prices went up, and you’ll usually get one of two answers. The first is the government spent too much. The second is companies raised prices because their own costs went up. During COVID-19, both were true at once: shipping got disrupted, pushing costs up the chain, and the government spent heavily trying to stimulate the economy. A 2024 survey of American households, run by economists at Harvard and Princeton, found exactly this: people don’t reach for a textbook definition when they talk about inflation. They reach for a cause, and the two explanations above cover most people’s answers (1).
If you’ve heard a definition of inflation before, it’s probably one shaped like this: the CPI’s own, since that’s the number behind every headline. The Bureau of Labor Statistics defines it as ‘the average change over time in the prices paid by urban consumers for a market basket of consumer goods and services.’ Most other price indexes, the PCE, the PPI, the GDP deflator, are built on the same basic shape: a sustained rise in prices over time, measured across some basket of goods. What none of them do, CPI included, is tell you why. They measure the symptom and leave the cause out entirely (2).
There are at least three distinct definitions of inflation in active use, and unlike CPI’s, each one names a cause. Each captures something real, and each points to a different mechanism, a different measurement approach, and a different policy response. Conflating them doesn’t just produce imprecise language. It produces wrong diagnoses, wrong treatments, and a century of economic decisions calibrated against a number that was answering the wrong question.
What CPI Leaves Out
The first and oldest definition is the classical, monetary definition, and it is older than the word inflation itself. The theory traces back to the Salamanca School in sixteenth-century Spain and to Jean Bodin in 1568, both trying to explain why prices kept rising as New World silver flooded into Europe, and David Hume gave it its classical formulation in 1752: too much money chasing too few goods. When the word inflation entered common economic usage in America, during the currency debates of the 1860s and 1870s, it meant this and only this in the common usage of the day. The 1864 Merriam-Webster defined it as undue expansion or increase, from over-issue, said of currency. The word did not start out describing the symptom. It started out describing the cause, and only drifted toward meaning a general rise in prices over the course of the twentieth century, not settling into that sense until around the 1960s (3, 4, & 5).
In this definition, inflation is the expansion of the money supply beyond the productive capacity of the economy. The dollar loses purchasing power not because any particular good became more expensive, but because the unit of account itself became less valuable. More dollars exist, each one representing a smaller claim on the real economy than it did before.
This definition treats inflation as a monetary phenomenon first and a price phenomenon second. Prices rise because the dollar weakened, not the other way around. The cause is in the money supply. The prices are the symptom. Milton Friedman and the Chicago School did not invent this idea in the twentieth century. What they did was test it rigorously against modern data and give it a quantitative backbone it had never had, roughly four hundred years after the Salamanca School first reasoned their way to the same conclusion, watching prices rise as Spanish ships came home (3 & 4).
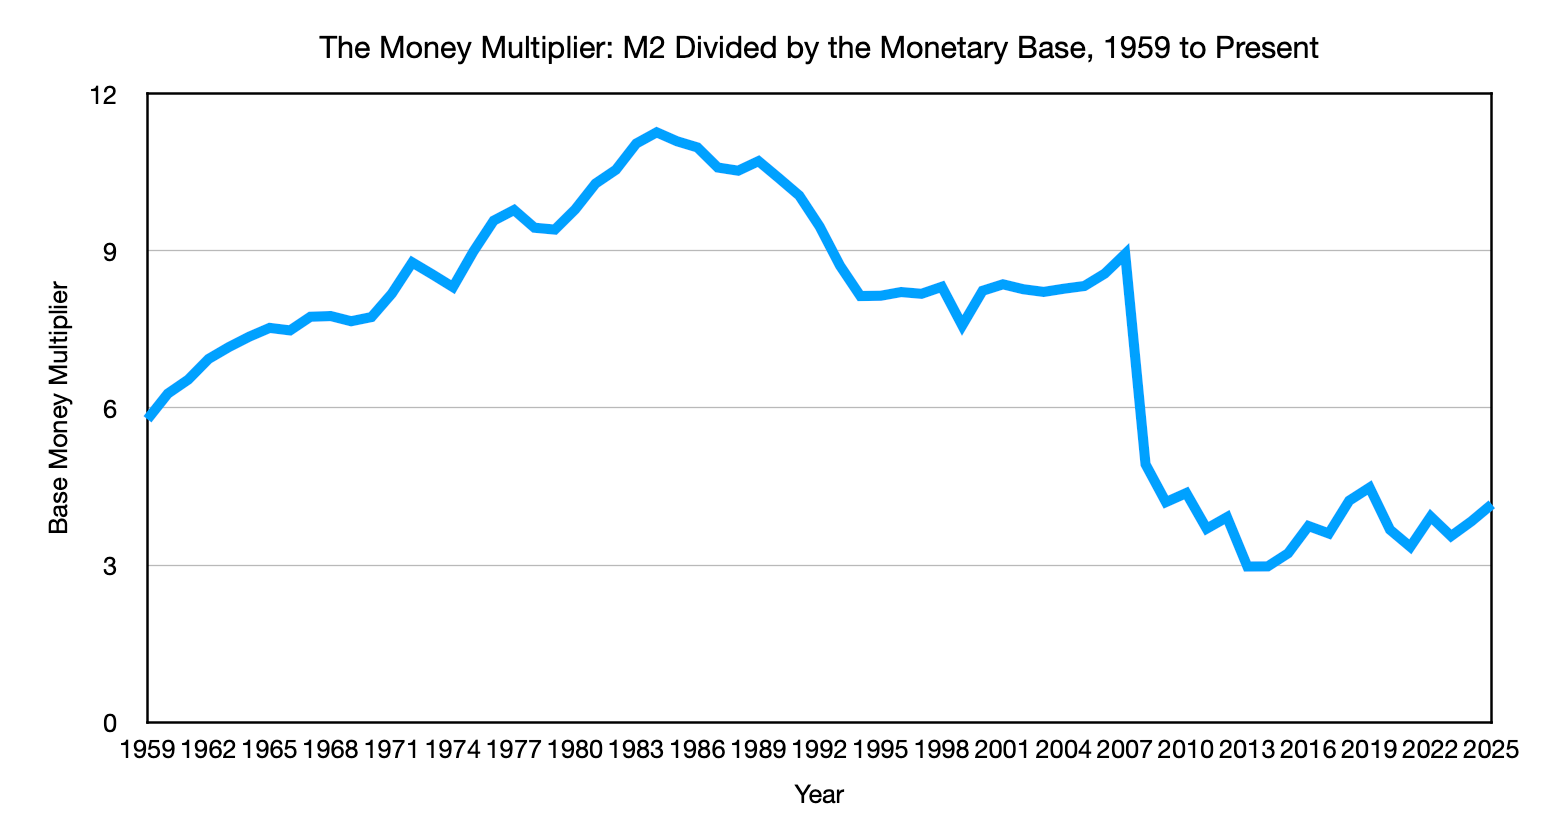
Knowing the definition is one thing. Watching it operate in the economy is another, and that starts with where the money comes from. The Federal Reserve creates base money directly, currency and bank reserves, but base money sitting in reserve accounts does not by itself put a single new dollar into anyone’s hands. The money that reaches the real economy and does the work of devaluing the dollar is broad money, M2: currency in circulation plus the deposits created every time a bank makes a loan. Most of the money supply is created this way, through bank lending, not through the Fed printing currency directly. That is why a large expansion of the Fed’s balance sheet does not automatically translate into a matching expansion of M2, and it is part of why the aggressive balance sheet growth since 2008 did not produce inflation dollar for dollar. The money multiplier, the ratio between M2 and the monetary base, has fallen sharply over that period. Base money can expand without the dollar losing ground, as long as it stays parked rather than lent out and spent (6).
The second definition is the demand-pull definition, first given its formal shape by John Maynard Keynes in 1940, in a wartime pamphlet called How to Pay for the War. Keynes described what he called the inflationary gap: the point where demand for goods outstrips what the economy can produce, even at full employment. The idea was further formalized by Arthur Smithies in 1942 and became central to Keynesian economics, where it still dominates modern central bank policy. In this definition, inflation occurs when aggregate demand for goods and services exceeds aggregate supply at current prices, causing prices to rise. Too much spending power relative to available supply. This definition locates the cause in the real economy, in the relationship between what people want to buy and what producers can deliver, rather than in the money supply directly (7, 8).
The third definition is the cost-push definition, and it’s younger than the other two. It took shape in the late 1950s, when economists were watching prices rise without the excess demand a strict Keynesian model said should be there to explain it, and needed a new category to account for it. Cost-push attributes price increases to rising production costs that producers pass through to consumers. Raw material prices rise, wages rise, energy costs rise, and businesses raise their prices to protect margins. This definition locates the cause on the supply side of the economy rather than the demand side (9).
This piece is scoped to developed economies, where these three definitions do the actual work. Structural inflation, the kind studied in less developed economies with different constraints, foreign exchange bottlenecks, and inelastic agricultural sectors unable to shift resources toward industry, runs on a different mechanism entirely and sits outside what this framework currently addresses.
These two were treated as rivals almost from the start, one side arguing prices rise because of demand, the other because of costs, as though only one could be the real explanation. That fight never fully resolved. It resurfaced most recently in the argument over the 2021 to 2023 inflation surge, with prominent economists arguing demand and stimulus were the driver while others pointed to supply bottlenecks and energy shocks, the same divide, eighty years later, still being fought with the same two tools. It helps to separate two questions that this rivalry has always blended together (10).
Demand-pull and cost-push describe the mechanism a price increase travels through: spending outrunning supply, or a rising cost getting passed forward into a higher price. Neither one, by itself, says where the extra spending power or the cost pressure came from. That source can be monetary, new money entering the system, or it can be real: a genuine shift in what people want, a population change, a drought, a war that destroys productive capacity, none of which require a single new dollar to exist. The monetary definition is not a third rival sitting next to the other two. It is one of at least two possible sources feeding into either channel. The real economy can push demand or costs higher on its own, and when it does, the increase behaves very differently than when the same channel is being fed by monetary expansion instead, which is exactly why it matters whether CPI can tell the two apart.
CPI, the instrument used for virtually every major economic decision in the United States and most developed economies, is not built to favor any one of these forces. It measures the price movement of a basket of consumer goods and services over time, a neutral count of what things cost, and in principle it should register a price increase the same way no matter which channel it traveled through or what was feeding it, demand-pull, cost-push, or the monetary source sitting underneath either one.
A price mover is a price mover, regardless of its cause. That’s exactly what the three definitions are not for. They don’t make CPI more accurate, and they were never meant to, CPI’s job is to count, not diagnose. What the definitions do is tell you what to do with the number once you have it, since the same reading of the same index calls for a completely different response depending on which of the three produced it.
In practice it does not work that way, and the reason is not a flaw in the basket. It is what happens to the monetary signal before the basket ever sees it. That is the puzzle this series is built around.
Why Two of the Three Correct Themselves
The puzzle from the end of the last section, why CPI doesn’t register the monetary signal at full force, comes down to a mechanism worth understanding directly: why the demand-pull and cost-push channels describe something real but fundamentally different from a monetary origin feeding into them.
The source-versus-mechanism distinction from the last section matters here directly. A demand-pull or cost-push episode fed by a real shift in the economy tends to correct itself, because the underlying resource, spending power, or the cost pressure doesn’t stay put. It reallocates, or supply eventually catches up. The same channel fed by monetary expansion does not correct itself the same way, because the new money is not reallocated away from anywhere. It is a permanent addition sitting in the system. That gives you two things to watch for when a price increase shows up: whether it persists instead of fading, and whether it shows up broadly, across many categories at once, or stays confined to one.
A stubborn, single-category price increase, like housing, is usually a real supply constraint working through cost-push or demand-pull. Housing’s persistence has identifiable, well-documented causes that have nothing to do with the money supply: zoning and permitting restrict how much new housing can reach high-demand areas, and construction labor productivity has been flat for decades while most of the rest of the economy improved. Both push the category higher on their own. A persistent, broad, simultaneous increase across categories is the signature of a monetary origin, because only new money entering the system touches every category the same way at once. Both signatures matter, and the rest of this section works through why (11 & 12).
When demand exceeds supply in a specific market, and prices rise, two things happen simultaneously. The higher price reduces the quantity demanded, because some buyers are priced out or choose substitutes. And the higher price increases the incentive for producers to supply more, because higher prices mean higher returns for anyone who can bring additional supply to market. Both effects work to close the gap. The price rise that looked like inflation is the market’s correction mechanism doing its job: allocating scarce goods to their highest-value uses while signaling producers to expand supply.
This is not abstract theory. It is the mechanism that makes markets work. And it operates within what economists call a fixed nominal envelope, the total amount of money in circulation. When demand-pull price increases occur in one category, households have less money to spend on other categories. The spending reallocates. Some prices rise, and others fall. The overall price level may show temporary movement, but the system tends toward a new equilibrium without any change in the total money supply.
Cost-push works similarly. When production costs rise in a specific industry and prices increase, consumers reduce their purchases of that product or find substitutes, which is demand destruction. The demand destruction limits how far the price increase can go and how long it can persist. Meanwhile, the higher cost environment creates incentives for producers to find more efficient production methods or alternative inputs. The price signal is doing its job: identifying a real economic constraint and incentivizing the system to address it.
The Iran war oil shock argument illustrates this precisely. When oil prices spike, households face higher energy bills. In a hypothetical, you have $100 to spend, and your energy bill rises from $8 to $12; you now have $4 less for everything else. That is a painful reallocation. But the nominal $100 has not changed. The oil shock changed where your money goes, not what your money is worth. Somewhere in the economy, the oil producer now has an extra $4 to spend on other things. The total purchasing power in the system is unchanged.
Historical data confirms this pattern. The 1990 Gulf War oil shock, the 1999 to 2000 price run-up, and the 2003 to 2008 super-spike all involved large oil price moves. In each case, headline inflation showed temporary pressure and then normalized without producing a sustained broad-based inflation regime. The feared runaway inflation did not materialize because the underlying monetary environment was not accommodating the shock with an expanded money supply.
There is an obvious objection to this, and it deserves a direct answer rather than a wave of the hand. Energy is not a category like any other. It sits inside the cost structure of nearly everything: transportation, plastics, fertilizer, shipping. An oil shock does not stay contained to the gas pump. It touches the input costs of almost every business in the economy at once. So why doesn’t it produce the same broad, simultaneous price increase that a monetary expansion does?
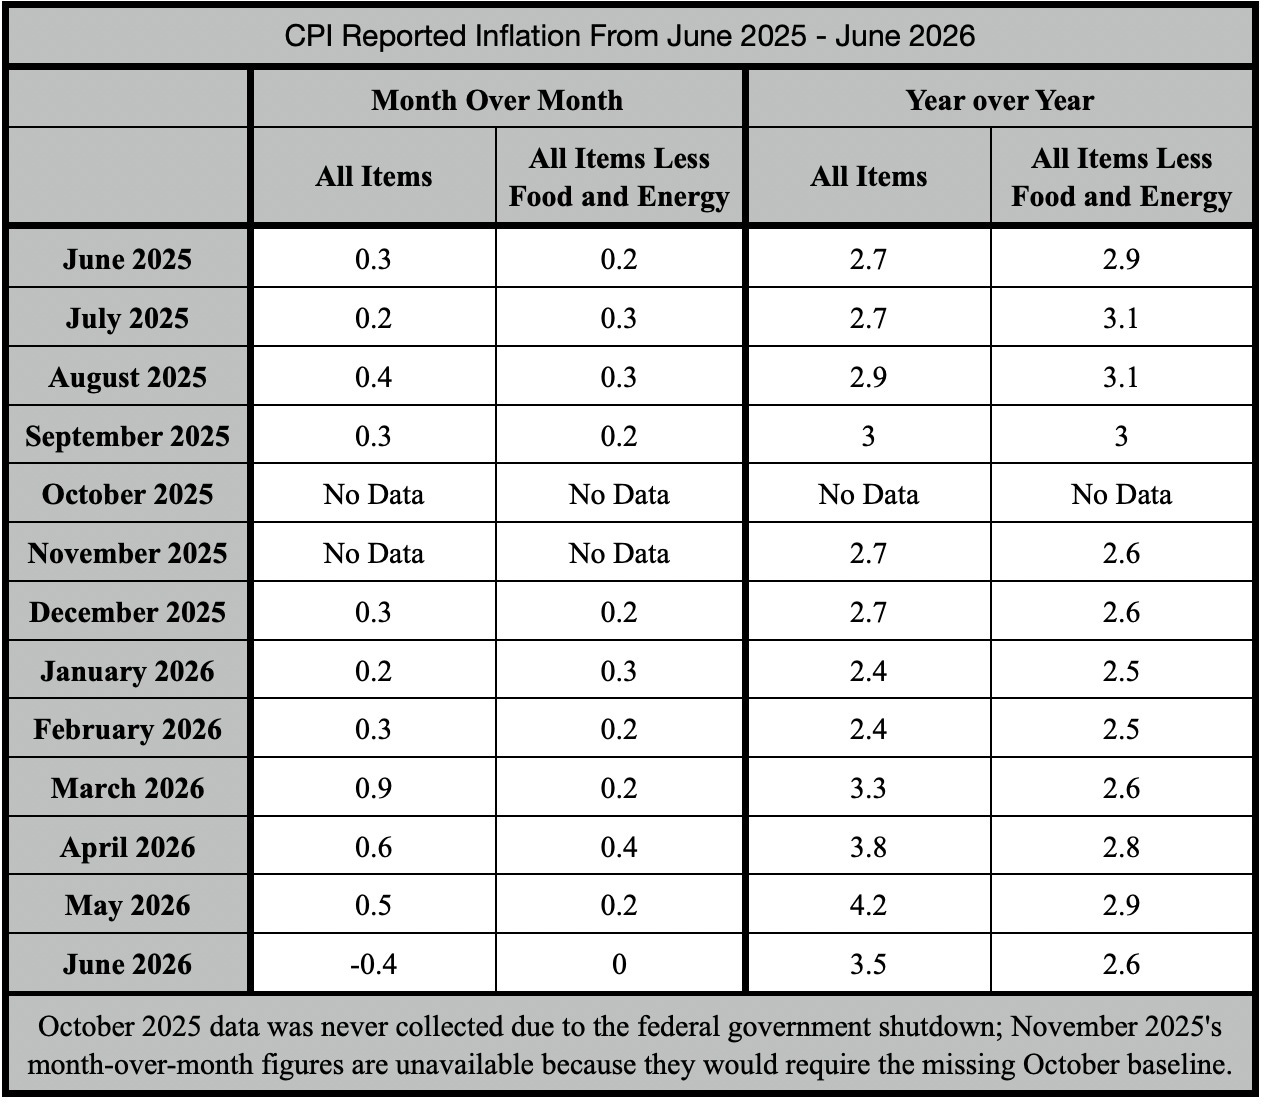
The answer is that broad exposure to a cost increase is not the same as a broad ability to pass it on. When an oil shock raises costs unevenly, some businesses are more energy intensive than others, no single business can raise its own price to cover the full hit without losing customers to a less exposed competitor who didn’t need to. That competitive pressure holds the price down and forces the cost into margins instead. This is exactly what the 2026 data has been showing: core inflation, the measure that strips out food and energy, has moved only slightly through June even as energy costs rose. Businesses have had nowhere to pass the cost without losing the customer who could simply buy from someone else, so the cost is being absorbed in margins rather than passed to the shelf.
A monetary expansion works differently. When the money supply grows, every buyer’s spending power rises at once, and every seller faces that same lift in demand simultaneously. Nobody loses relative position by raising their price, because everyone else is raising theirs too. That symmetry, not the number of categories touched, is what makes monetary expansion capable of a sustained, economy-wide price increase in a way a cost shock, even a broad one, is not.
The supply constraint caveat is important and worth stating explicitly. The self-correcting mechanism assumes reasonably competitive markets with reasonably elastic supply. In markets where supply is structurally constrained by regulation, zoning, permitting timelines, or other barriers, the correction is slower and sometimes incomplete within any observable timeframe. As we discussed earlier, housing is the clearest example. The price signal works. The supply response is so delayed by structural barriers that the practical outcome can look like sustained price increases even without monetary expansion.
The policy implication from this is worth noting. The correct response to supply-constrained price increases is supply-side preparation and investment, not monetary policy and not price controls. Price controls suppress the signal the market is trying to send. Monetary policy aimed at supply-side price increases treats the symptom in the wrong category entirely. And the time to address supply constraints is before the shortage arrives, not during it. Having adequate supply infrastructure in place before an emergency is the first-best solution. Allowing market prices to clear during an emergency is the second-best. Price controls are a third option that produces worse outcomes than either.
What Moves Every Price at Once
Here is what separates the monetary definition from the demand-pull and cost-push definitions.
Demand-pull and cost-push price movements are category-specific. When housing prices rise because of a supply constraint, food prices do not necessarily rise. When oil prices spike because of a geopolitical event, clothing prices do not necessarily rise. These are relative price shifts: some things get more expensive relative to other things, but the overall price level can remain stable if the spending reallocation and demand destruction effects offset the initial price increase.
For a sustained, broad-based increase in prices across all categories simultaneously, there is only one mechanism capable of producing that outcome. Not demand-pull, which is category-specific and self-correcting. Not cost-push, which is also category-specific and produces demand destruction that limits and eventually reverses the price rise in the affected category. Only the devaluation of the unit of account itself, monetary expansion beyond the productive capacity of the economy, is broad enough to lift prices across every category, and keep them there, at the same time.
When the dollar loses purchasing power, everything priced in dollars rises simultaneously. Not because demand surged for every product at once. Not because production costs rose in every industry at once. But because the measuring stick got shorter. The goods did not become more expensive. The dollar became less valuable. And the price of everything in dollars rises when the dollar weakens, regardless of what is happening in any specific market.
This is the monetary definition’s core insight. True sustained inflation, the kind that compounds year over year and never normalizes on its own, is always and only a monetary phenomenon. The temporary price spikes that get labeled as inflation in the news, the oil shock, the supply chain disruption, the commodity run-up, are relative price adjustments. They are real, and they hurt households. But they are self-correcting and they do not require monetary policy intervention to resolve.
The distinction matters enormously for policy. Treating a supply-driven relative price adjustment as monetary inflation and responding with interest rate increases tightens the monetary environment for an economy that does not have a monetary problem. It destroys demand across the entire economy to address a price increase that was confined to one sector and was already in the process of correcting itself.
This is also where CPI’s blind spot actually comes from, and it is worth being precise about it, because CPI is not incapable of registering monetary inflation. CPI is a neutral basket. If the dollar weakens, the basket should show it. The problem is that the monetary signal rarely arrives at full strength by the time it reaches the price tag. Productivity, and quite possibly other forces this series has not yet examined, absorb part of that signal upstream, lowering costs before a price is ever set. What CPI ends up recording is monetary inflation net of whatever got absorbed along the way. CPI is not blind to monetary inflation. It is measuring it after something else has already taken a bite out of it, and nothing in the basket can tell you how big that bite was.
The 2026 Test Case
The pattern the theory predicts is specific. A one-time price level shift, like the oil move earlier this year, produces elevated year-over-year comparisons for approximately twelve months, an artifact of what’s called the base effect. Say energy prices jump 50% and then hold at that new, higher level. For the next twelve months, every year-over-year comparison is measuring this month’s elevated price against a year-ago month that was still at the old, lower price. This results in the year-over-year number staying high even though nothing new is happening; it’s still catching up to a single event from a year earlier.
Only once a full year has passed does the comparison finally run month-against-month at the same elevated level, and if the price genuinely hasn’t moved since, the year-over-year figure drops on its own. The same base effect shows up in the month-over-month reading too; it just works almost instantly instead of taking a year, because that comparison is only ever measuring this month against last month’s price level, with no twelve-month delay built in. If the price stopped rising after the initial jump, the month-over-month change goes flat right away, since last month’s price is already sitting at the new, elevated level rather than the old one. Monetary inflation, by contrast, produces persistent month-over-month increases that accumulate into large year-over-year figures and do not normalize on their own without policy intervention or something happening to the dollar.
The Iran war began in early March 2026, and oil prices peaked in April and May. Headline CPI moved sharply in response; month-over-month readings peaked at 0.9% in March 2026 and remained elevated compared to before the oil spike for the rest of spring before turning negative by June to -0.4%. The year-over-year rate tells a different story. Rates rose from roughly 2.4% in February, peaked at 4.2% in May 2026 before pulling back to 3.5% by June, a reversal inside three to four months. Core CPI moved as well, but far less: its year-over-year peak during the shock, in May, reached roughly 2.9 percent, no higher than where core was already sitting in June and July of 2025, nearly a year before the war began and with no comparable energy shock anywhere in sight. If the shock were meaningfully driving core inflation, core should have broken past its own recent history. Instead, it returned to a level it had already visited on its own recently (13).
When people say an oil shock causes inflation, they are not picturing what the 2026 data shows, a spike that reverses within months once the shock passes. The reference point in most people’s heads is the 1970s: years of embedded, self-reinforcing price growth that never seemed to end. That fear is legitimate. It is just built on a different kind of episode than the one this piece has been describing.
The 1970s looked different not because the Fed reacted wrong to the oil shock, but because the oil shock landed inside a monetary and fiscal environment that was already inflationary. Vietnam-era spending had pushed CPI from 1.9% in 1965 to nearly 6% by 1970. Nixon’s 1971 wage-price controls masked that pressure rather than resolving it, and when the controls were phased out through 1973, the suppressed inflation surged back, CPI hit roughly 9 percent that year, before the oil embargo, which didn’t begin until October 1973, had even affected prices. Oil then compounded an inflation problem that was already underway, not the other way around (14).
The other oil shocks on record, 1990, 1999, and 2003 to 2008, didn’t hit an economy carrying that same pre-existing condition. Each one landed, pushed prices up temporarily, and normalized on its own, the same pattern the 2026 episode just showed. The 2026 shock belongs with that group: a real, visible move in the data that reversed within months, not the kind of sustained, self-reinforcing pressure the 1970s comparison actually describes.
The M2 puzzle
This brings us back to the definitions and the puzzle embedded in them.
CPI uses the price-level definition of inflation. It is designed to capture all the forces that move prices, including monetary expansion, demand-pull effects, cost-push effects, and everything else that affects what consumers pay. By construction, CPI should capture at least as much inflationary pressure as any single one of its input causes.
But that is not what the data shows.
Since 1970, M2 per capita, a measure of just one of the forces that CPI is supposed to capture, has grown by roughly a factor of 20.55. CPI says prices have risen only about 7.93 times over the same period. A measurement designed to capture more causes of price movement than monetary expansion alone is producing a number less than half the size of the measure of just one of those causes (6, 14, 15).
That is not a rounding error. That is a structural finding. And it demands an explanation that the standard frameworks do not provide.
The explanation is Part 2.
Reference
Introduction
1. Binetti, Nuzzi, and Stantcheva, “People’s Understanding of Inflation,” Journal of Monetary Economics (2024), https://www.sciencedirect.com/science/article/pii/S0304393224001053
2. Bureau of Labor Statistics, “Handbook of Methods: Consumer Price Index”, https://www.bls.gov/opub/hom/cpi/
Monetary definition / etymology
3. Grice-Hutchinson, “A Reassessment of Scholastic Monetary Theory,” Journal of the History of Economic Thought (1993), for the Salamanca School specifically, https://www.cambridge.org/core/journals/journal-of-the-history-of-economic-thought/article/abs/reassessment-of-scholastic-monetary-theory/59A1DB55F04539E39EFF1584100B6E10
4. Laidler, “David Hume and Irving Fisher on the Quantity Theory of Money,” (Duke HOPE working paper), for the Salamanca School and Hume attribution, https://hope.econ.duke.edu/sites/hope.econ.duke.edu/files/Hume%20and%20Fisher%20on%20the%20Quantity%20Theory1.pdf
5. Noah Webster, An American Dictionary of the English Language, revised by Chauncey A. Goodrich and Noah Porter (Springfield, MA: G. & C. Merriam, 1864), s.v. “inflation,” definition 4, p. 689. Available at https://archive.org/details/americandictiona00websuoft/page/689.
Federal Reserve / money multiplier
6. Federal Reserve Bank of St. Louis, M2 money stock (M2SL), https://fred.stlouisfed.org/series/M2SL
Demand-pull
7. Keynes, John Maynard. How to Pay for the War: A Radical Plan for the Chancellor of the Exchequer. London: Macmillan and Co., Limited, 1940. https://fraser.stlouisfed.org/title/pay-war-6021.
8. Smithies, “The Behavior of Money National Income Under Inflationary Conditions,” Quarterly Journal of Economics 57, no. 1 (1942): 113–128.
Cost-push
9. “The Baffling New Inflation: How Cost-Push Inflation Theories Influenced Policy Debate in the Late-1950s United States,” History of Political Economy, Duke University Press (2015), https://read.dukeupress.edu/hope/article-abstract/47/4/605/12665
2021–2023 debate
10. Ferreira, “Inflation in Theory and Practice: A Comprehensive Review of the Literature From the Great Inflation to the 2020s Surge,” Journal of Economic Surveys (2026), DOI: 10.1111/joes.70114
Zoning / housing
11. Glaeser and Gyourko, “The Impact of Zoning on Housing Affordability,” NBER Working Paper No. 8835 (2002), https://www.nber.org/system/files/working_papers/w8835/w8835.pdf
12. Glaeser, Gyourko, and Saks, “Why Is Manhattan So Expensive? Regulation and the Rise in Housing Prices,” Journal of Law and Economics 48, no. 2 (2005): 331–369.
Real-time data table
13. Bureau of Labor Statistics, Consumer Price Index for All Urban Consumers: All Items and All Items Less Food and Energy, June 2025–June 2026, https://www.bls.gov/cpi/, accessed (August 2, 2026).
14. Bureau of Labor Statistics, “Historical Consumer Price Index for All Urban Consumers (CPI-U): U.S. City Average, All Items,” Table 24, https://www.bls.gov/cpi/tables/historical-cpi-u-201710.pdf
Population
15. Bolt and van Zanden, “Maddison Style Estimates of the Evolution of the World Economy: A New 2023 Update,” Journal of Economic Surveys (2024), DOI: 10.1111/joes.12618, for population through 2022, plus Census Bureau vintage estimates for 2023 and 2024 to close the gap.
Author: Kyle Novack
August 4, 2026
A Monumental Venture, LLC: research project (Novack Equilibrium Theory – NETs)
Attribution Required: © 2025–2026 Kyle Novack / Monumental Venture, LLC. For educational use with credit; commercial use requires permission. Full details in linked PDFs.