
NETs Core Claim: The 1.5% CPI Drift
Summary Memo


Core claim
The Consumer Price Index (CPI) systematically understates true monetary inflation by about 1.5 percentage points per year. This is not a free parameter; it is a triangulated estimate derived independently from multiple mainstream data sources that were not designed to support this thesis.
Step 1: Direction of the error (logic only)
The direction of the CPI error follows from standard mechanisms, without any new data.
Productivity reduces unit production costs.
BLS Total Factor Productivity (TFP) data show agricultural productivity growth of roughly 1.5% per year since 1948, and non‑farm business TFP growth around 2.1% per year.
Competitive markets pass cost reductions into lower prices than would otherwise exist.
Brookings (Dew‑Becker & Gordon) estimate that a 1% increase in trend productivity growth reduces measured inflation by 1.34%, and the San Francisco Fed explicitly links productivity gains to lower inflation via pass‑through.CPI measures final retail prices after this pass‑through.
By definition, CPI is constructed from the prices consumers actually pay at the end of the production chain.
It follows that CPI measures net inflation (monetary inflation minus productivity‑driven deflation already embedded in prices) rather than gross monetary inflation. The correction must therefore be upward; only the size is an empirical question.
Step 2: Magnitude of the error (triangulation)
Five independent, mainstream sources converge on an annual understatement in the 1.2–1.8% range, with a central tendency near 1.5%.
The conventional bias literature provides a floor: official work already admits 0.5–1.6% bias, though it is framed as “overstating cost of living” rather than missing productivity deflation.
Sectoral productivity (especially agriculture) and the Case-Shiller vs. CPI wedge cluster around ~1.5%, providing a central empirical anchor.
M2 per capita divergence and non‑farm TFP define a plausible upper bound; pushing the correction much above ~2% produces series (e.g., million‑dollar 1970s houses) that are visibly implausible.
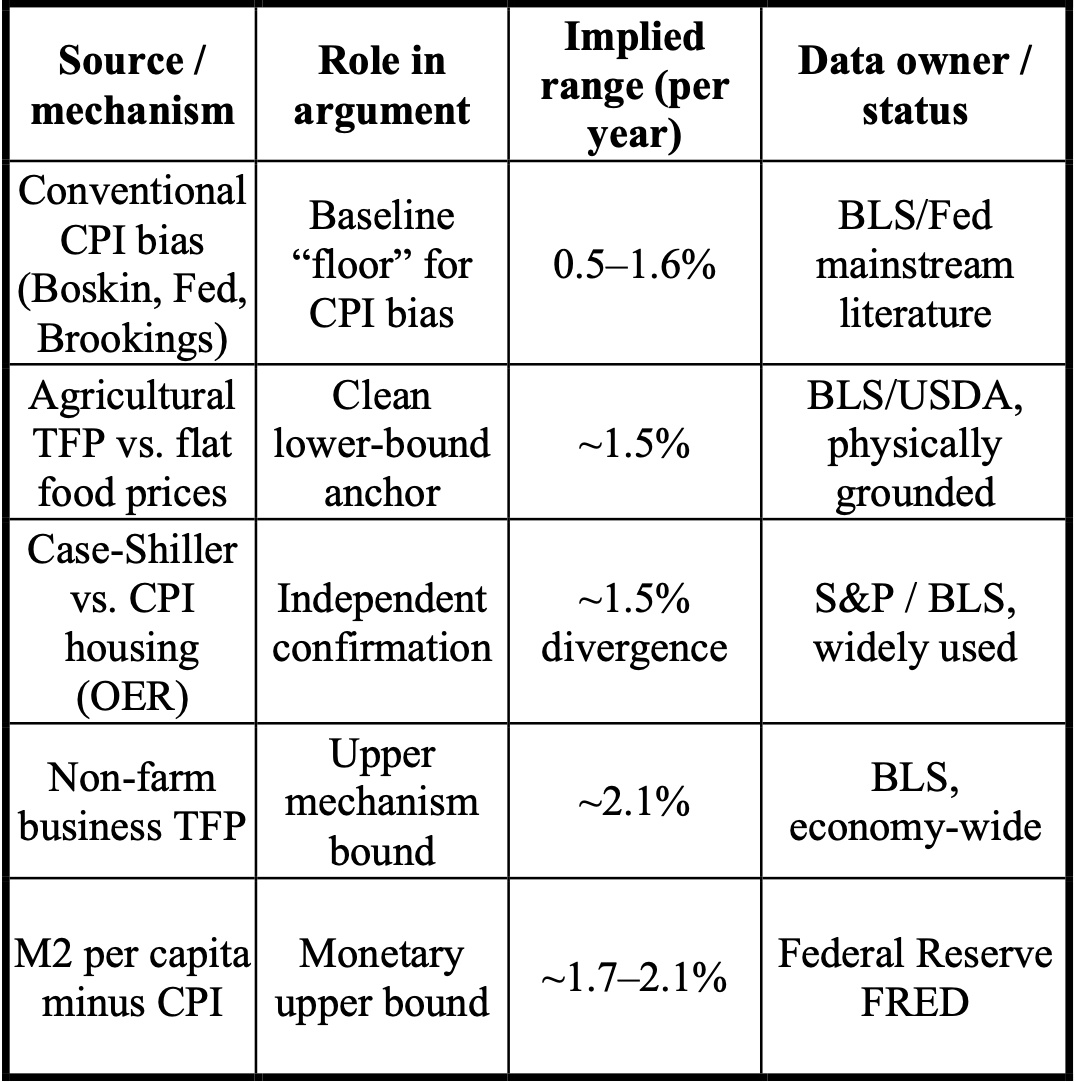
Across all five, a constant drift in the neighborhood of 1.5% is the unique range that (a) fits the mechanisms and (b) produces non‑absurd corrected series.
Step 3: What the 1.5% correction explains
Applied cumulatively from the early 1970s, a 1.5% annual understatement is sufficient to reconcile key macro series with both productivity data and lived experience.
Median household income
Officially: roughly 83,000 dollars in recent data.
Under NETs correction: closer to 110,000 dollars, consistent with a roughly 50% wage share of GDP rather than the apparent long‑run collapse in labor’s share.NET
Housing and “asset booms”
Official CPI‑adjusted home prices show a steep upward trend.
With ~1.5% drift added, long‑run median home prices in 2024 dollars become nearly flat, matching the view that typical houses have not become radically more expensive in real terms, and that much of the apparent boom is mismeasured inflation.
Money supply and prices
Since the mid‑20th century, M2 per capita has outpaced CPI by roughly 1.7–2.1% per year.
CPI plus ~1.5% brings the price level into line with the long‑run path of money per person, rather than leaving a persistent unexplained gap.
These corrections jointly dissolve several standard puzzles: stagnant wages despite record productivity, a housing “crisis” without proportionate construction cost changes, and a money–prices gap often attributed to mysterious velocity shifts.
Step 4: How to falsify the NETs 1.5% drift
The argument is only meaningful if it is open to being proven wrong. NETs make a set of clear, testable claims.
4.1 Mechanism‑level falsification
Claim: CPI is, by construction, net of productivity deflation.
The framework would be falsified at the mechanism level if rigorous evidence showed that at least one of the following is false:
Productivity growth does not reduce unit production costs in the aggregate (contrary to BLS TFP and standard cost theory).
Competitive markets do not pass cost reductions into lower prices than would otherwise obtain, even over long horizons.
CPI does not in fact measure final retail transaction prices paid by households, but something earlier in the chain.
If any of those foundations fail, the necessity of an upward correction to CPI disappears.
4.2 Triangulation breakdown across independent series
Claim: A single, approximately constant drift (~1.5%) improves the fit of multiple independent series simultaneously.
Falsification route:
Reconstruct key series (housing, wages, GDP per capita, tax revenue per capita, money supply per capita) under alternative CPI drift adjustments using standard, transparent methods.
Test whether any constant correction in the 1.0–2.0% band
Flattens housing into a plausible band.
Stabilizes wages and per-person government revenue.
Aligns the cumulative price level with per-person money.
If no single drift produces this multi‑series coherence, i.e., if housing “prefers” 0.3%, wages 2.8%, taxes –0.5%, and money 0.0%, with no overlap—then the triangulated 1.5% claim fails.
4.3 Sectoral productivity vs prices
Claim: The gap between productivity growth and CPI‑adjusted prices in high‑productivity sectors is of the same order as the proposed drift.
Falsification route:
Run sector‑level regressions of TFP growth on sector price changes (controlling for input costs and monetary expansion) across agriculture, manufacturing, and services.
Estimate the pass‑through and the residual wedge between observed price behavior and what productivity alone would predict.
If those regressions show no systematic residual wedge (i.e., CPI fully reflects productivity‑driven price declines), or a wedge that is small and inconsistent in sign across sectors, the “missed productivity deflation” mechanism is undermined.
4.4 Money–prices relationship
Claim: Over decades, CPI plus ~1.5% tracks the expansion of effective money per person better than headline
Falsification route:
Construct long‑run series for M2 per capita and compare them to cumulative CPI and CPI plus various drifts.
If headline CPI already fits money per person as well or better than any drift‑adjusted alternative (including 1.5%), there is no monetary “gap” left for NETs to explain.
4.5 Structural NETs claims beyond CPI
The broader NETs picture adds two further claims that can also be rejected by data.
Flat or nearly flat GDP per capita under the correct adjustment:
If credible reconstructions using alternative, defensible inflation treatments still show strong, sustained growth in real GDP per person over 100–200 years, the “constant value of a human hour” claim is wrong.Human time as 80–90% of value:
In NETs, “human time” is broader than formal labor compensation. It includes: (a) labor compensation (wages, salaries, benefits), (b) all corporate profits and proprietors’ income, treated as returns on past and present human time applied to land and capital, (c) government spending on personnel and labor‑intensive services, and (d) the labor component of private investment and overhead that exists to organize, coordinate, and deploy human work. At the level of the whole economy, land and natural resources only generate profit once human beings locate, extract, refine, transport, and sell them, so even resource‑intensive sectors ultimately express human time as the binding constraint; using 2019 BEA and Fed data, summing these categories yields a human‑time share of roughly 87.1% of GDP, versus only about 42% if you look at narrow labor compensation alone.
How to Falsify:
This broader claim would need to be revised if a careful decomposition of GDP (using BEA income‑side accounts and assigning all profits, mixed income, and public outlays according to the NETs rules above) consistently found that this extended human‑time bundle is well below the 80–90% band and stable in a much lower range over time (for example, clustering near 50–60% rather than around 80–90%).
Step 5: The epistemic fork for critics
Because every ingredient in this argument comes from standard public series and mainstream mechanisms, a critic must either:
Reject those mechanisms (e.g., productivity pass‑through, CPI’s definition, the quantity theory of money), or
Show, via transparent reconstructions, that when you apply the same data with standard tools, the ~1.5% drift no longer yields the best multi‑series fit.
Either path is a valid empirical challenge. But simply asserting that CPI is “roughly right on average” without addressing the specific mechanisms and multi‑series triangulation is no longer enough once the falsification criteria are on the table.
This document assumes familiarity with the core argument. If you have not read the narrative version, start with the “Food Puzzle Master Summary” or the full series beginning at Part 1. For more Technical Proof read “The Hidden 1.5% Inflation Gap” and “NETs: Unmasking Economic Illusions with Time-Based Truth.”
References (partial list)
Selected data and benchmark sources used in the NETs technical summary; a full reference list is available on request.
Bolt, J., & van Zanden, J. L. (2024). Maddison style estimates of the evolution of the world economy: A new 2023 update. Journal of Economic Surveys. Advance online publication. https://doi.org/10.1111/joes.12618
Boskin, M. J., Dulberger, E. R., Gordon, R. J., Griliches, Z., & Jorgenson, D. W. (1996). Toward a more accurate measure of the cost of living: Final report to the Senate Finance Committee from the Advisory Commission to Study the Consumer Price Index. U.S. Senate Committee on Finance. https://www.ssa.gov/history/reports/boskinrpt.html
CoreLogic. (2026). S&P CoreLogic Case‑Shiller U.S. National Home Price Index [Data set]. Retrieved April 22, 2026, from https://www.spglobal.com/spdji/en/indices/indicators/sp-corelogic-case-shiller-us-national-home-price-nsa-index
Federal Reserve Bank of St. Louis. (2024). Gross domestic product (GDP) [Data set]. FRED, Federal Reserve Bank of St. Louis. https://fred.stlouisfed.org/series/GDP
Federal Reserve Bank of St. Louis. (2024). Median sales price of houses sold for the United States (MSPUS) [Data set]. FRED, Federal Reserve Bank of St. Louis. https://fred.stlouisfed.org/series/MSPUS
Federal Reserve Bank of St. Louis. (2026). Average hourly earnings of all employees, total private (CES0500000003) [Data set]. FRED, Federal Reserve Bank of St. Louis. https://fred.stlouisfed.org/series/CES0500000003
Federal Reserve Bank of St. Louis. (2026). Velocity of M2 money stock (M2V) [Data set]. FRED, Federal Reserve Bank of St. Louis. https://fred.stlouisfed.org/series/M2V
MeasuringWorth. (2025). What was the U.S. GDP then? Retrieved March 14, 2026, from https://www.measuringworth.org/usgdp
U.S. Bureau of Labor Statistics. (2013). Average food prices: A snapshot of how much has changed over a century (Beyond the Numbers, Vol. 2, No. 13). U.S. Department of Labor. https://www.bls.gov/opub/btn/volume-2/average-food-prices-a-snapshot-of-how-much-has-changed-over-a-century.html
U.S. Bureau of Labor Statistics. (2026). Consumer price index for all urban consumers (CPI‑U) [Data set]. U.S. Department of Labor. https://www.bls.gov/cpi/
U.S. Census Bureau. (2024). Historical income tables: Households [Data set]. U.S. Department of Commerce. https://www.census.gov/data/tables/time-series/demo/income-poverty/historical-income-households.html
U.S. Department of Agriculture, Economic Research Service. (n.d.). Agricultural productivity in the U.S.: Summary of recent findings. Retrieved March 14, 2026, from https://www.ers.usda.gov/data-products/agricultural-productivity-in-the-united-states/summary-of-recent-findings
U.S. Department of Agriculture, Economic Research Service. (n.d.). Farm income and wealth statistics: Annual cash receipts by commodity [Data set]. Retrieved March 14, 2026, from https://data.ers.usda.gov/reports.aspx?ID=4055
U.S. Department of Agriculture, National Agricultural Statistics Service. (2023). Crop production 2022 summary (January 2023, ISSN 1936–3737). https://www.nass.usda.gov/Publications/Todays_Reports/reports/croptr22.pdf
U.S. Department of Agriculture, National Agricultural Statistics Service. (2025). Crop production 2024 summary (January 2025, ISSN 1936–3737). Cornell University Library. https://downloads.usda.library.cornell.edu/usda-esmis/files/k3569432s/nk324887m/qn59s0097/cropan25.pdf
Author: Kyle Novack
May 9, 2026
A Monumental Venture, LLC: research project (Novack Equilibrium Theory – NETs)
Attribution Required: © 2025–2026 Kyle Novack / Monumental Venture, LLC. For educational use with credit; commercial use requires permission. Full details in linked PDFs.