
Scarcity Was Never the Problem
Food Puzzle: Part 8

At this point in the Food Puzzle, we have already called agriculture, the supply chain, and corporate market power to the witness stand to see whether they swallowed the cost savings that should come with massive productivity gains. Each has been dismissed. This is not hyperbole when it comes to productivity. It is what ought to happen in a well‑functioning economy. When inputs stay broadly stable while output surges, those input costs are spread over many more units, pushing the average cost per unit down for consumers.
Now it is time to call a new witness: external shocks and offsets. Droughts, wars, pandemics, and energy price spikes can clearly push prices up in the short run by creating temporary imbalances. Supply contraction causes uncertainty while demand stays the same or even rises. The question is whether a long enough string of such events could plausibly keep overall food prices permanently elevated, erasing the savings that productivity says should be there.
How to Read the Data in This Section
All numbers and charts in this part of the Food Puzzle draw on standard public data sets, including USDA crop and calorie‑availability series, BLS inflation indexes, international energy statistics from the U.S. Energy Information Administration, and global production data from Our World in Data and related sources. To avoid clutter, I keep in‑text citations brief; each figure includes a short note on how it was constructed, and a dedicated “Methods and data sources” section at the end lists every underlying series and transformation (such as inflation adjustments or per‑capita conversions) so readers can audit or replicate the calculations. Unless otherwise noted, all dollar amounts are expressed in CPI‑U‑adjusted 2024 dollars, while physical quantities (such as tons or pounds of crops and calories per person) and ratios (such as per‑capita production) are reported in their natural units.
What the Supply Data Actually Show
The broader data argue strongly against that explanation. The USDA and related agencies maintain detailed, long‑running accounts of the U.S. food system, including daily per‑capita calorie availability after adjusting for food loss. From 1970 to 2010, that measure has risen by about 22%. This is crucial because the series is already after harvest and accounting for food loss.
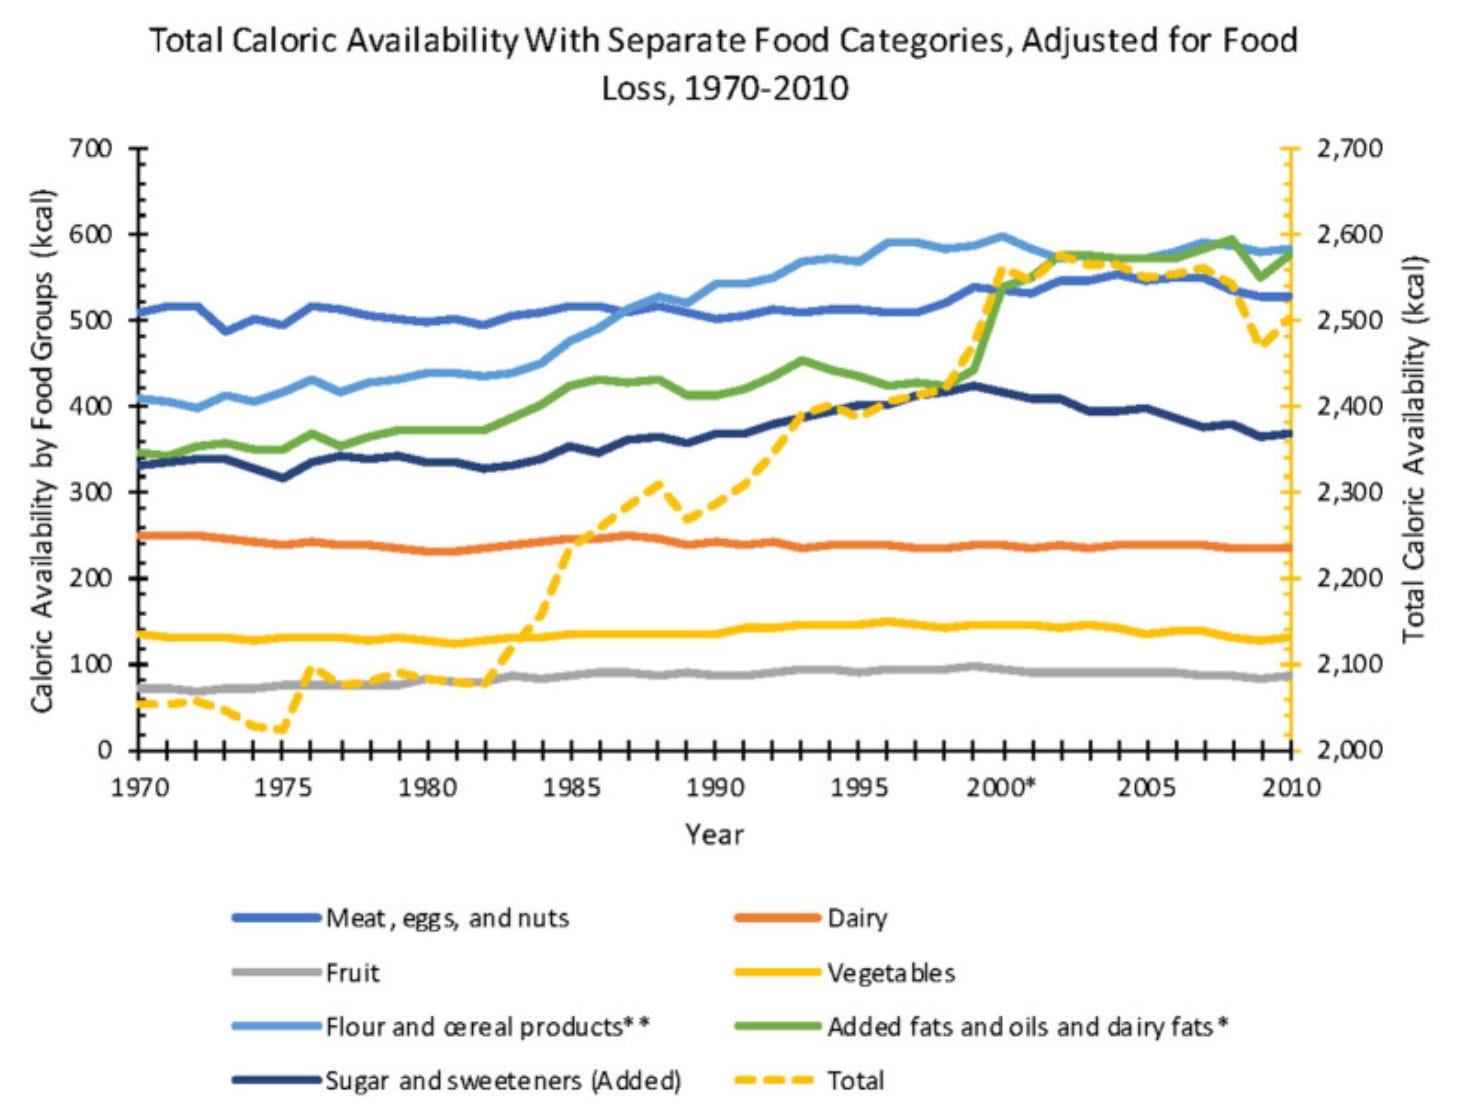
If widespread, persistent shortages were truly eroding the productivity dividend, we would expect total available calories per person to fall, or at least become unstable, over time. Instead, total availability and availability by major food group remain remarkably steady, even through large regional weather shocks. For example, the 1977 drought hit much of the western United States, including California.
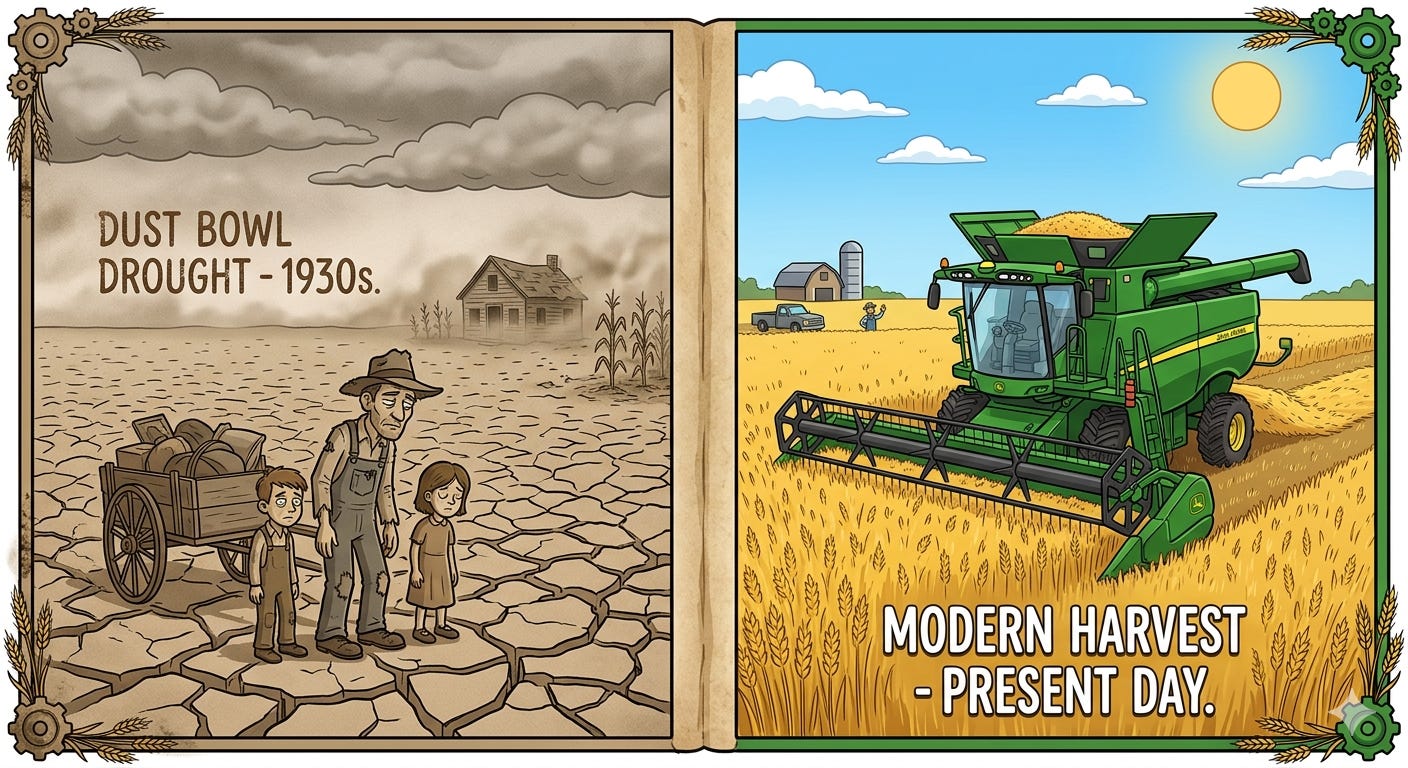
History tells a similar story in more extreme episodes. During the Great Depression and the Dust Bowl, conditions on the ground were brutal for farmers in the hardest‑hit regions: crops failed, soil blew away, and families lost both land and livelihoods. Yet when we step back to the national data, per‑capita crop production rises from its 1929 lows through 1939, when the drought finally eased (USDA, 2022).
In other words, local hardship and visible distress did not translate into a collapse in national food supply. As transportation, storage, and logistics have improved, the geography of production has diversified. Over time, the U.S. food system has become increasingly resilient, able to absorb most natural disasters without threatening overall availability, even when certain regions or specific crops are hit hard.
How the Food System Has a Built‑In Backstop
There is also a quiet safety valve in the system that rarely shows up in standard discussions: food waste. Estimates suggest that up to 40% of food in the United States is ultimately discarded, with an implied value of around $218 billion per year. This waste cannot explain why prices have not fallen more, for two reasons. First, much of it occurs after purchase, once the food has already cleared the supply chain. Second, historical spoilage during production and distribution was higher than it is today. This means technical progress has reduced waste upstream in the supply chain, even as consumer‑side waste has increased (RTS, n.d.).
What it does tell us, however, is that there is a built‑in backstop against genuine, long‑run scarcity. In a true supply crunch where shortages are felt directly, households have a powerful incentive to cut back on what they throw away. This would stretch available supply without needing a proportional jump in production, making it even harder for external shocks to sustain chronically high prices on their own.
When Psychology Manufactures Shortages
If availability has been broadly stable or rising, why do prices still spike in certain periods? One answer is that many of the most visible “supply shocks” are really episodes of fear and uncertainty rather than large, lasting collapses in physical supply. The early months of COVID‑19 are a vivid example. People walked into stores and saw empty shelves. Your social media feed filled up with photos of stripped‑bare aisles, and the now‑famous toilet‑paper panic became a kind of national joke with a real edge of anxiety behind it.
Faced with a frightening unknown, households and companies both stopped behaving like calm optimizers. Shoppers grabbed whatever they could, and firms hesitated to run down inventories because they did not know how long the disruption would last. As Jonathan Haidt notes in The Happiness Hypothesis (2006), under stress, we lean heavily on emotion and intuition. The resulting rush to hoard toilet paper, despite no underlying shortage in production capacity, captured that shift perfectly.
Industry estimates from IndexBox show that the U.S. market for toilet paper, napkins, towels, and tissue was about 23 billion dollars in 2020, up only 2.3% from the year before, compared with an average growth rate of 4.4% from 2007 to 2020. In other words, sales grew less than usual in the year of peak panic despite the viral images of scarcity.
Why Shocks Don’t Stay in Charge
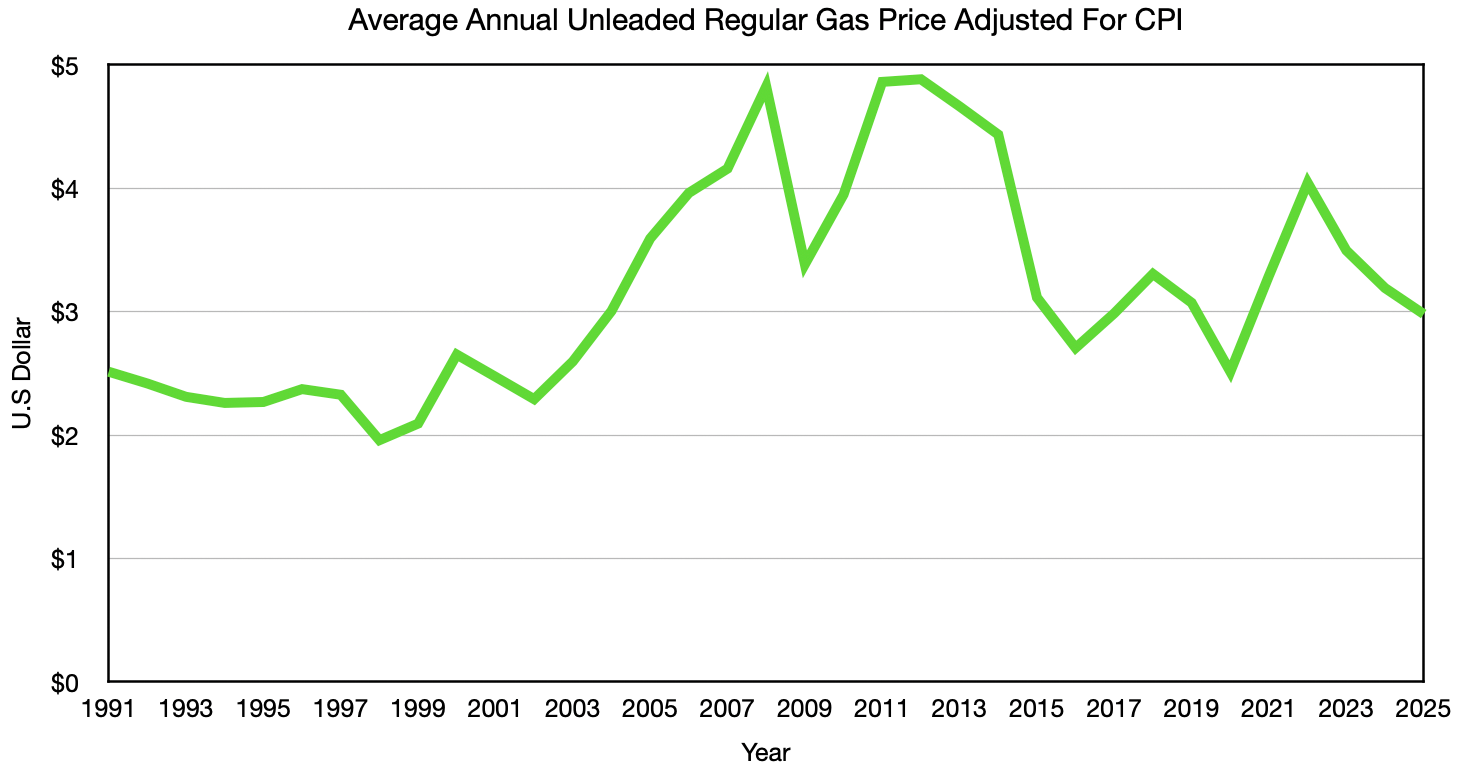
The 2022 invasion of Ukraine offers another test case that many people felt directly at the gas pump. Almost overnight, headlines warned of threats to both energy and key agricultural exports. This was most notable as U.S. drivers watched gas prices at the pump climb week after week. Russia was the world’s largest wheat exporter at the time, with Ukraine also a major player. For crude oil, Russia was the third‑largest producer globally, supplying about 11.2% of global output according to the U.S. Energy Information Administration. Sanctions on Russian oil tightened markets and helped push the national average price of regular unleaded gasoline to about $5.02 per gallon in June 2022, compared with an average of $2.91 per gallon in 2021, a roughly 72.5% increase from the annual average to the peak (U.S. Energy Information Administration, 2026 & U.S. Energy Information Administration, n.d.)
Even here, the story is less about a permanent collapse in supply than about a violent adjustment period. Russian oil did not vanish; it was rerouted to buyers such as China and India, and once new trade patterns settled in, prices eased back. In CPI-adjusted dollars, U.S. gasoline prices have since drifted toward levels consistent with mid-2000s real prices, signaling that the war-related spike was sharp but temporary, not a new, permanent plateau.
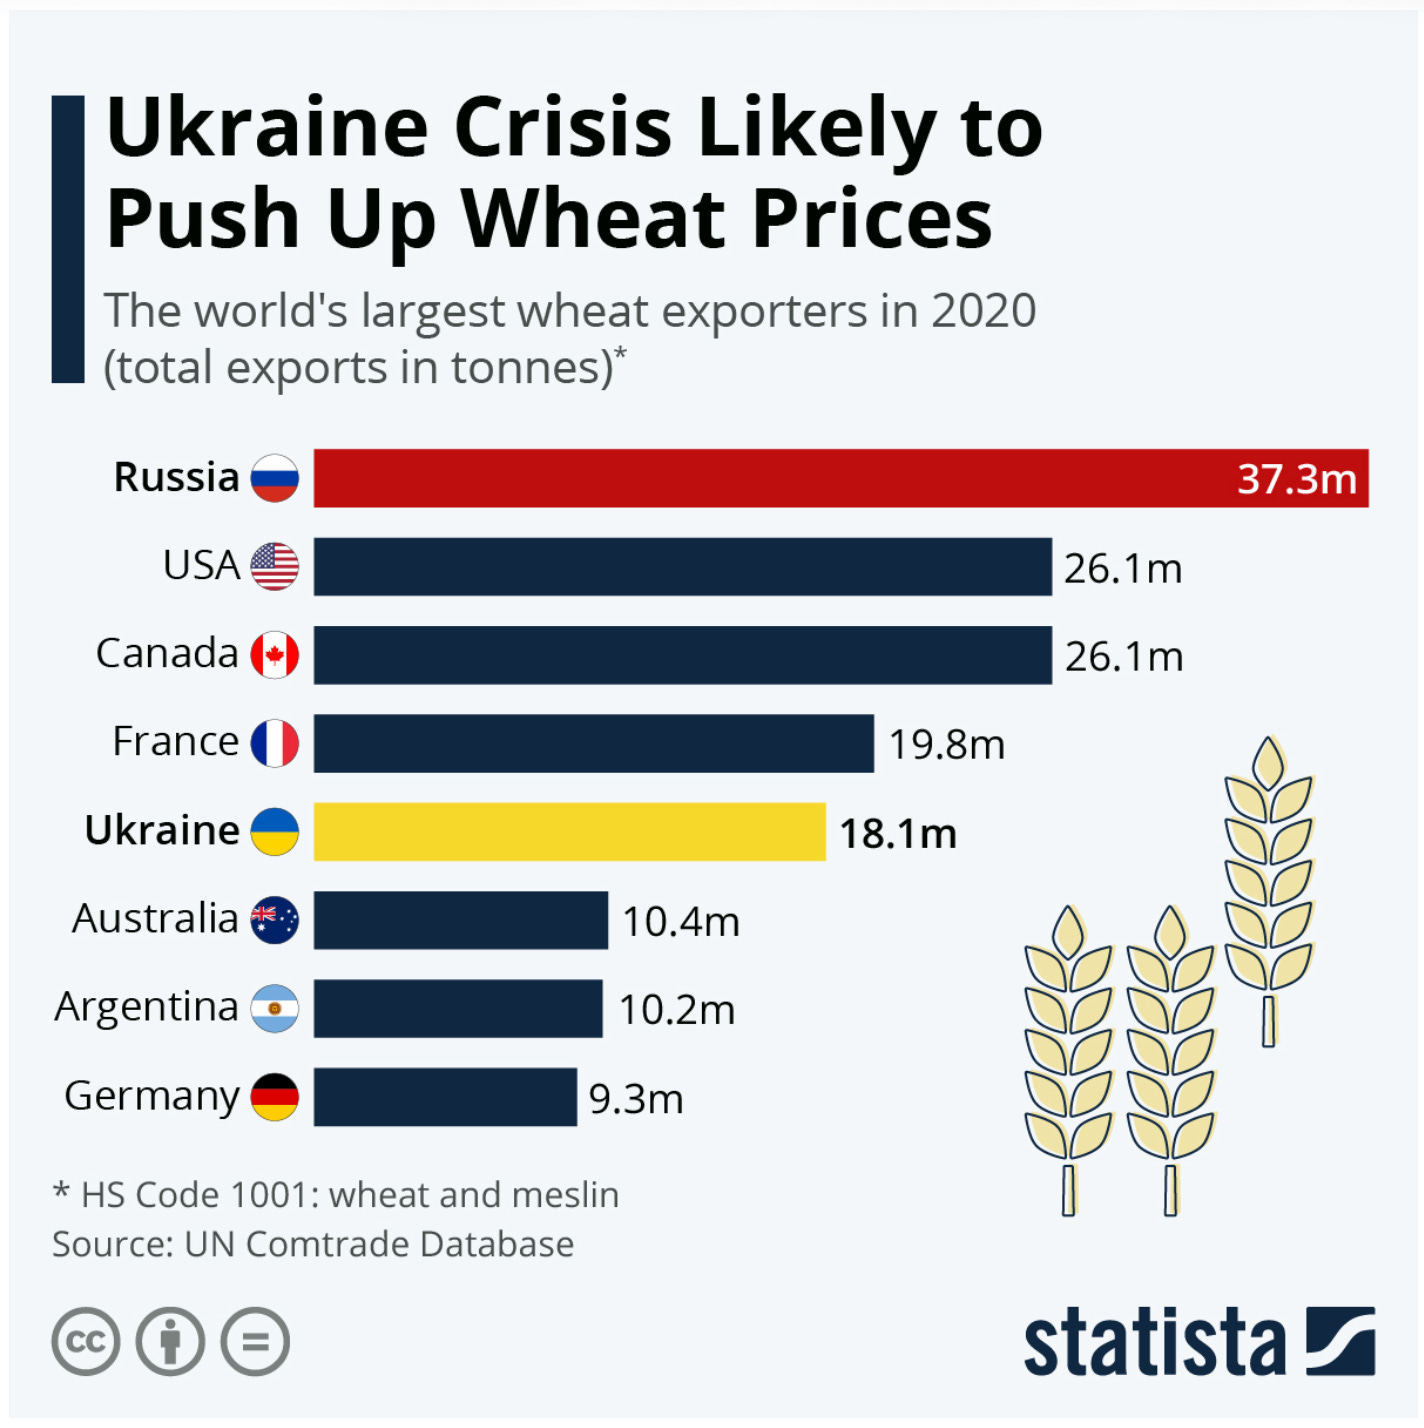
Wheat and other crops followed a similar arc globally. Wheat prices surged under the combined pressure of the Ukraine invasion and COVID‑era logistics snarls, with average annual prices rising about 28% from 2021 to 2022, yet global wheat production increased as Ukraine’s output fell, Russia’s rose, and total world tonnage moved higher rather than collapsing (Macrotrends LLC, n.d.).
By 2025, after adjusting for overall inflation, wheat prices had retreated to levels in line with the lowest points of the prior quarter-century. Famine conditions never materialized in the United States or in any location not actively engaged in conflict. From the vantage point of a shopper standing in a bread aisle, the episode felt like “supply shock inflation.” In the data, it looks like a temporary price bulge on top of a system whose underlying capacity continued to expand.
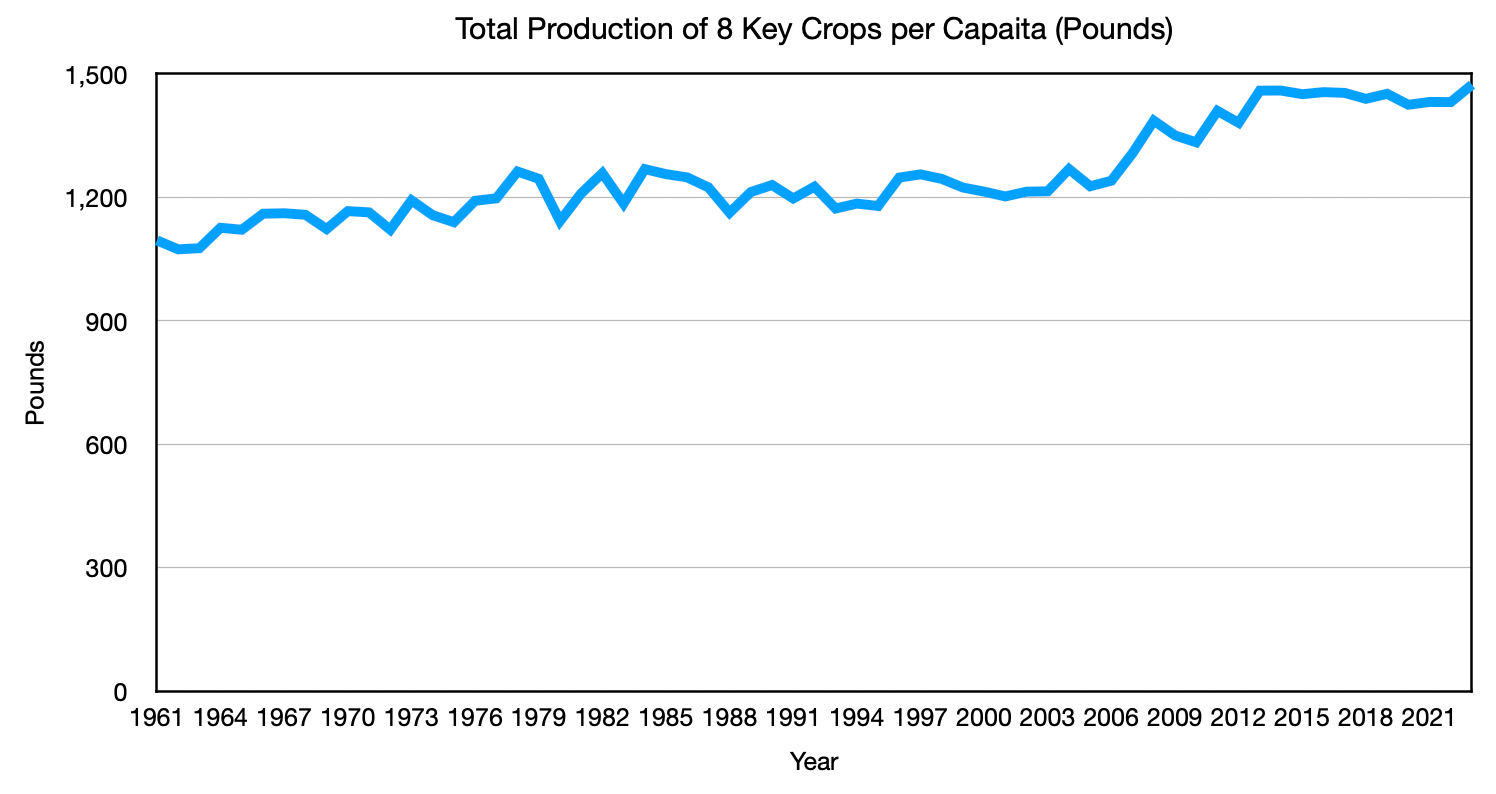
When we zoom out even further, the resilience of the system becomes even clearer. Looking at eight key global crops from 1961 to 2023, barley, maize (corn), potatoes, rice, soybeans, sugarcane, sunflower, and wheat, combined per‑capita output follows a steady upward trend rather than a pattern of repeated shortfalls. There are no long‑lasting declines large enough to support the idea that recurring supply shocks have kept world food supplies chronically tight. If sustained, multi-decade high prices were driven by physical scarcity alone, we would expect to see persistent dents in this kind of per-person production data. Instead, per-person production has increased.
Scarcity Was Never the Problem
Putting these pieces together, we reach a clear verdict. External shocks and offsets can absolutely cause sharp, short‑term surges in food and energy prices and inflict real hardship on specific regions, crops, and producers. But the national and global production data, the behavior of per‑capita availability, and the way prices eventually normalize all point in the same direction. These shocks do not hold prices high enough, for long enough, to consume the missing savings that productivity gains say should have shown up. As a long‑run explanation for why food prices have not fallen more, “supply shocks did it” fails under scrutiny and joins the supply‑chain and corporate‑greed stories as a third suspect to be dismissed from the witness stand in the Food Puzzle trial.
Before we move on from standard suspects, there is one last suspect that often lurks in the background of conversations about food prices: regulation. From food‑safety rules and environmental standards to labor laws and labeling requirements, it is easy to imagine a growing thicket of mandates quietly layering costs onto every meal and soaking up productivity gains. In the next section of the Food Puzzle, we will put that story on the witness stand and ask a narrower question: not whether regulation is costly, it clearly is, but whether those costs are large and persistent enough to explain why food prices have not fallen nearly as far as the physical world says they should.
Methods and Sources
Crop production during the Great Depression and Dust Bowl
I use historical production data from the U.S. Department of Agriculture, National Agricultural Statistics Service (NASS), as reported in Crop Production 2022 Summary and its underlying tables. The analysis covers ten major U.S. field crops—barley, cotton, maize/corn, oats, rice, soybeans, sugar beets, sugarcane, tobacco, and wheat. For each crop, I take total annual production for 1929 and 1939, convert quantities to a common unit where needed, and sum across crops to obtain aggregate output by year. The resulting comparison shows that total crop production increased between 1929 and 1939, despite the Great Depression and Dust Bowl, supporting the claim that national output rose even as regional conditions deteriorated.
Inflation‑adjusted U.S. gasoline prices
To compare recent gasoline spikes with earlier periods, I use annual average U.S. Regular Conventional Gas Price data from the U.S. Energy Information Administration, series GASREGCOVW, accessed via FRED, Federal Reserve Bank of St. Louis, for 1991–2025. I convert these nominal annual prices into constant 2024 dollars by deflating them with the CPI‑U (All Items) index from BLS, using 2024 as the base year. The resulting real price series shows the COVID‑19 and Russia‑Ukraine spikes as temporary surges, with inflation‑adjusted gasoline prices later receding toward levels consistent with the mid‑2000s rather than remaining permanently elevated.
Wheat production in Ukraine, Russia, and globally
To assess how the Russia–Ukraine war affected wheat supply, I use country‑level and global wheat production data from Our World in Data’s Agricultural production database (Ritchie, Rosado, & Roser, 2023). I extract annual wheat production (in tonnes) for Ukraine, Russia, and the world for 2021 and 2022, then compute percentage changes over this interval for each series. These calculations show that Ukraine’s wheat output fell sharply while Russia’s rose and global wheat production increased overall, supporting the claim that world supply did not collapse even though regional production was severely disrupted.
Global per‑capita production of staple crops
Annual production data for eight crops—barley, maize (corn), potatoes, rice, soybeans, sugarcane, sunflower, and wheat—come from Our World in Data’s Agricultural production database (Ritchie, Rosado, & Roser, 2023). Production data in tonnes were summed across the eight crops, converted to pounds using the factor 1 metric tonne = 2,204.62 pounds, and then divided by the annual world population from Worldometer’s World population by year series, which elaborates United Nations estimates, to obtain per‑capita values.
Sources
Haidt, J. (2006). The happiness hypothesis: Finding modern truth in ancient wisdom. New York, NY: Basic Books.
IndexBox. (2025, January 10). Market for toilet, towel, and tissue paper in the United States. Retrieved January 3, 2026, from https://app.indexbox.io/report/4803h9/840/
Lee, J. H., Duster, M., Roberts, T., & Devinsky, O. (2022). United States dietary trends since 1800: Lack of association between saturated fatty acid consumption and non‑communicable diseases. Frontiers in Nutrition, 8, 748847. https://doi.org/10.3389/fnut.2021.748847
Macrotrends LLC. (n.d.). Wheat prices – 60 year historical chart. Macrotrends. Retrieved April 9, 2026, from https://www.macrotrends.net/2534/wheat-prices-historical-chart-data
Richter, F. (2022, March 9). Ukraine crisis likely to push up wheat prices. Statista. Retrieved January 3, 2026, from https://www.statista.com/chart/26928/largest-wheat-exporters/
Ritchie, H., Rosado, P., & Roser, M. (2023). Agricultural production. Our World in Data. https://ourworldindata.org/agricultural-production
RTS. (n.d.). Food waste in America in 2026. Retrieved January 2, 2026, from https://www.rts.com/resources/guides/food-waste-america/
U.S. Bureau of Labor Statistics. (2025). Consumer Price Index for All Urban Consumers (CPI‑U): All items in U.S. city average [Data series CPIAUCSL]. Retrieved from https://www.bls.gov/cpi/
U.S. Energy Information Administration. (n.d.). Petroleum and other liquids: Annual refined petroleum products consumption, world. International data browser. Retrieved April 9, 2026, from https://www.eia.gov/international/data/world/petroleum-and-other-liquids/annual-refined-petroleum-products-consumption
U.S. Energy Information Administration. (n.d.). U.S. regular conventional gasoline price [GASREGCOVW]. In FRED, Federal Reserve Bank of St. Louis. Retrieved January 3, 2026, from https://fred.stlouisfed.org/series/GASREGCOVW
United States Department of Agriculture, National Agricultural Statistics Service. (2022). Crop production 2022 summary (ISSN 1936‑3737). https://www.nass.usda.gov/Publications/Todays_Reports/reports/croptr22.pdf
Worldometer. (n.d.). World population by year. Elaboration of United Nations data. Retrieved January 4, 2026, from https://www.worldometers.info/world-population/world-population-by-year/
Author: Kyle Novack
April 10, 2026
A Monumental Venture, LLC: research project (Novack Equilibrium Theory – NETs)
Attribution Required: © 2025–2026 Kyle Novack / Monumental Venture, LLC. For educational use with credit; commercial use requires permission. Full details in linked PDFs.