
The Two Economies: Why Your Gut Beats the Official Numbers
NETs Primer: Part 4 – Time vs land, value flow, and a warped unit of account

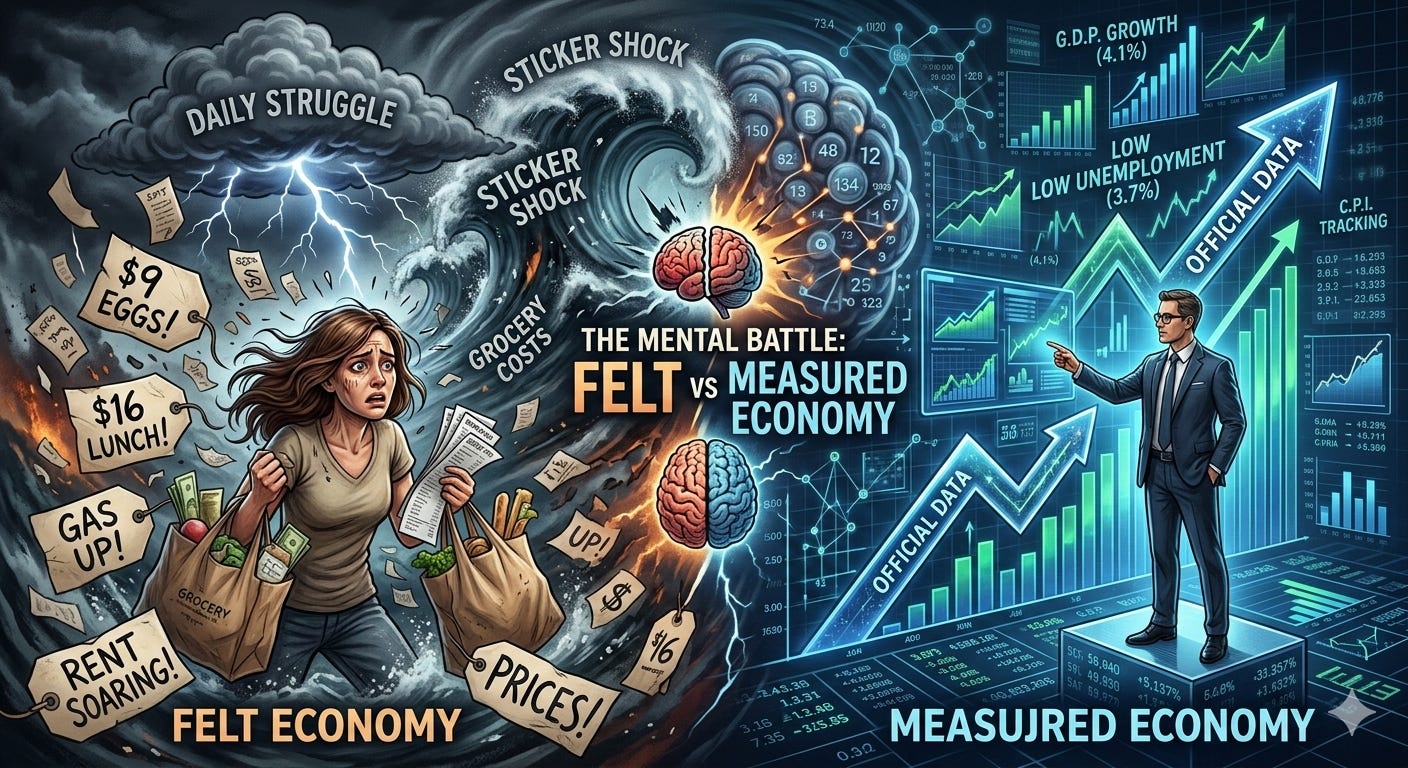
You’ve probably felt it: the news says the economy is strong, unemployment is low, inflation is “cooling,” and stock indexes keep flirting with highs—yet your paycheck never seems to stretch as far as it should. Rent, groceries, and healthcare chew through your budget, and the idea of a single income supporting a family feels like ancient history.
That disconnect is not in your head.
NETs calls it the split between the measured economy (what the stats say) and the felt economy (what your household experiences). And once you fix a quiet 1.5% error in our inflation data, the felt economy turns out to be the one telling the truth.
The measured economy: a story built on a warped ruler
On paper, the measured economy looks fine:
CPI inflation is bouncing around 2–4%.
GDP per capita is marching upward.
Productivity reports celebrate efficiency gains.
Using those tools, policymakers conclude:
Wages are at or near “record highs.”
Real living standards have steadily improved.
Affordability problems must be about behavior, politics, or “greed.”
But in my technical work, I showed that, when looking across long-run data series—wages, housing, government revenues, and corporate earnings—and stress-testing the CPI with small, constant errors, the numbers line up only when you add about 1.5 percentage points of missing inflation each year.
Over 50–100 years, that tiny drift compounds into a massive distortion. The result is a shadow inflation that official statistics don’t admit, but your wallet feels every month.
Big Macs and shadow inflation: when “cheap” should be cheaper
Take something simple: a fast‑food burger.
Official CPI says a 1967 Big Mac should cost about $4.19 in 2024 dollars.
The actual 2024 price is roughly $5.69—about 36% higher than the official adjustment says it “should” be.
At first glance, that looks like proof of corporate greed. But think about what’s happened since 1967:
Globalized supply chains.
Automation in farming and processing.
Huge economies of scale in logistics and restaurants.
McDonald’s turned the burger into an assembly line, extracting every efficiency they could find.
In a world with that much extra efficiency, a simple mass-produced burger should be dramatically cheaper in real terms than in 1967.
If you add back the missing 1.5% per year and use the corrected ruler, the same 1967 Big Mac comes to about $9.48 in today’s dollars. Against that benchmark, today’s $5.69 is not a rip-off—it’s a 40% real price collapse, exactly the kind of deflation any textbook economist would expect after decades of innovation and scale.
So, the burger story flips:
Official CPI: “Prices are a bit higher than they should be.”
Corrected lens: “Prices are much lower, as our intuition tells us, but the ruler was lying.”
This is shadow inflation: the part of inflation that should have been canceled out by productivity gains, but wasn’t, because we undercounted the true erosion of the dollar.
Wants vs needs: why life feels abundant and unaffordable at the same time
Once you fix the ruler, another paradox finally makes sense:
“Wants”—clothes, electronics, toys, streaming—feel cheap or manageable.
“Needs”—housing, healthcare, education—feel brutally expensive.
Here’s why.
Productivity has made it incredibly cheap to produce wants.
Factories, software, robotics, and global competition slash the human‑time cost of TVs, phones, shoes, and gadgets.
Even with mismeasured inflation, you still see lower or flat real prices in many of these categories.
Needs sit where productivity can’t fully bail you out.
You can’t automate land in a good school district.
You can’t mass-produce one-on-one medical care or truly personalized teaching in the same way you mass-produce smartphones.
Those “need” sectors tend to track actual inflation rather than the watered-down CPI version. Under a corrected 1.5% drift, those categories don’t magically become cheap; their rising prices finally make sense as a reflection of the labor and scarce resources they actually require.
The result:
Households are surrounded by inexpensive “wants,” which creates the illusion of abundance.
At the same time, the core “needs” that determine whether you feel secure—shelter, health, education—have quietly marched out of reach.
That’s why your life can be full of devices and subscriptions and still feel economically trapped.
The collapse of the average wage
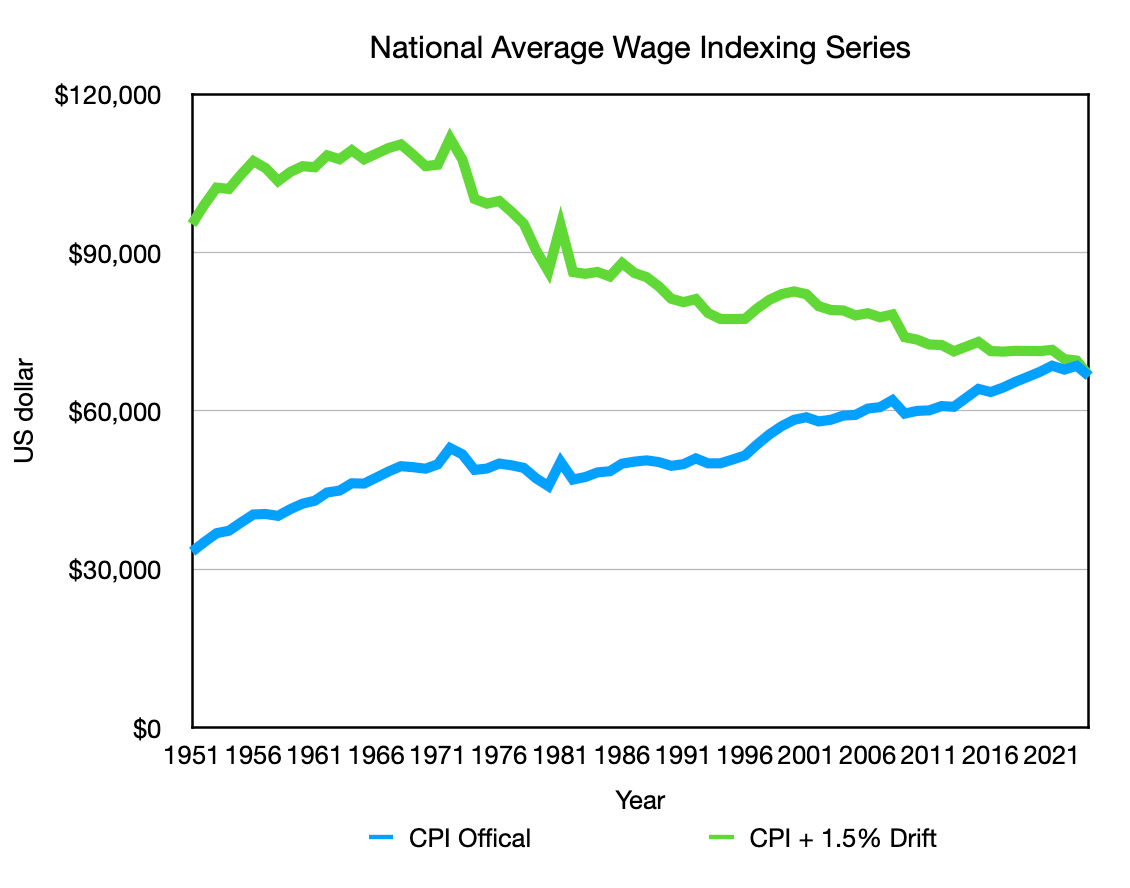
The wage data tell the same story once you use the corrected ruler.
Using the Social Security Administration’s National Average Wage Index and adjusting only with official CPI, wages look flat to slightly up since the 1970s. That’s the story most economists repeat: “Real wages have been roughly stagnant, not collapsing.”
Under the 1.5% correction, the picture changes:
Around 1970, the average worker’s income is about $106,399 in 2024 dollars.
Today, that same indexed measure is about $66,622.
That’s a drop of nearly 40% in real purchasing power for the average worker, even as GDP, productivity, and corporate profits set records.
How is that even possible without a social breakdown?
Because:
Productivity gains made “wants” dramatically cheaper to produce, so smaller paychecks still buy lots of stuff.
But “needs” followed true inflation, housing, healthcare, and education now eat a much larger share of a shrunken real income.
The one-income family of the 1970s wasn’t some nostalgic illusion; it was supported by real wage levels that quietly disappeared under the 1.5% shadow inflation. Two incomes and rising household debt became the ‘new normal’ only because our broken metrics convinced us we were paying people more, even as their true purchasing power fell.
Are corporations the villain—or co-victims?
It’s tempting to look at record corporate profits and decide the culprit must be “greedy corporations.” There are bad-behaved businesses out there, but the inflation story is more subtle.
In nominal terms, corporate profits are at all-time highs—because everything measured in dollars tends to hit nominal highs in an inflationary system.
When you look at profits as a percentage of GDP, the picture normalizes: a bit elevated at times, but not an unstoppable exponential curve.
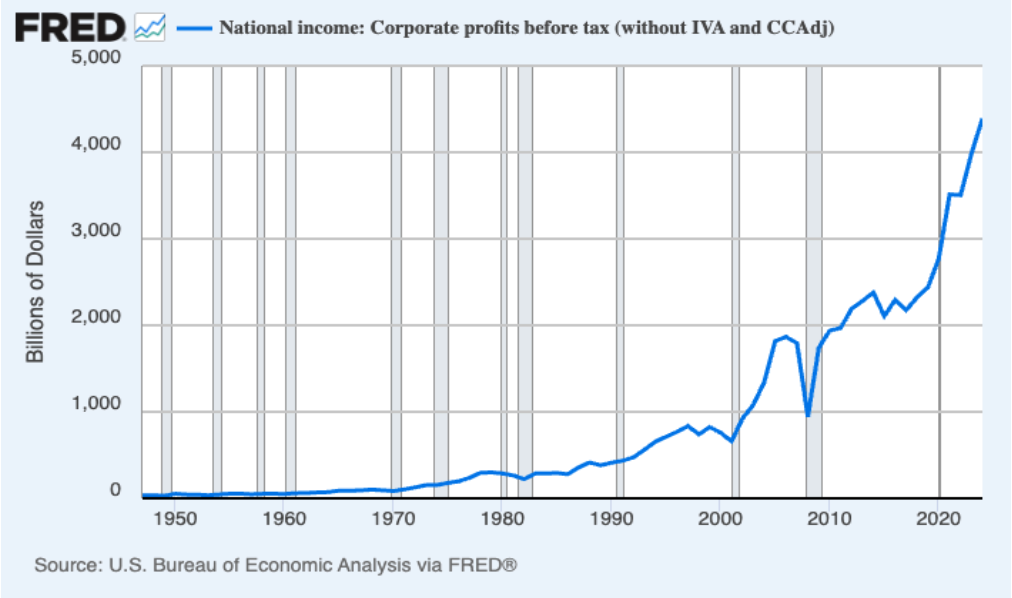
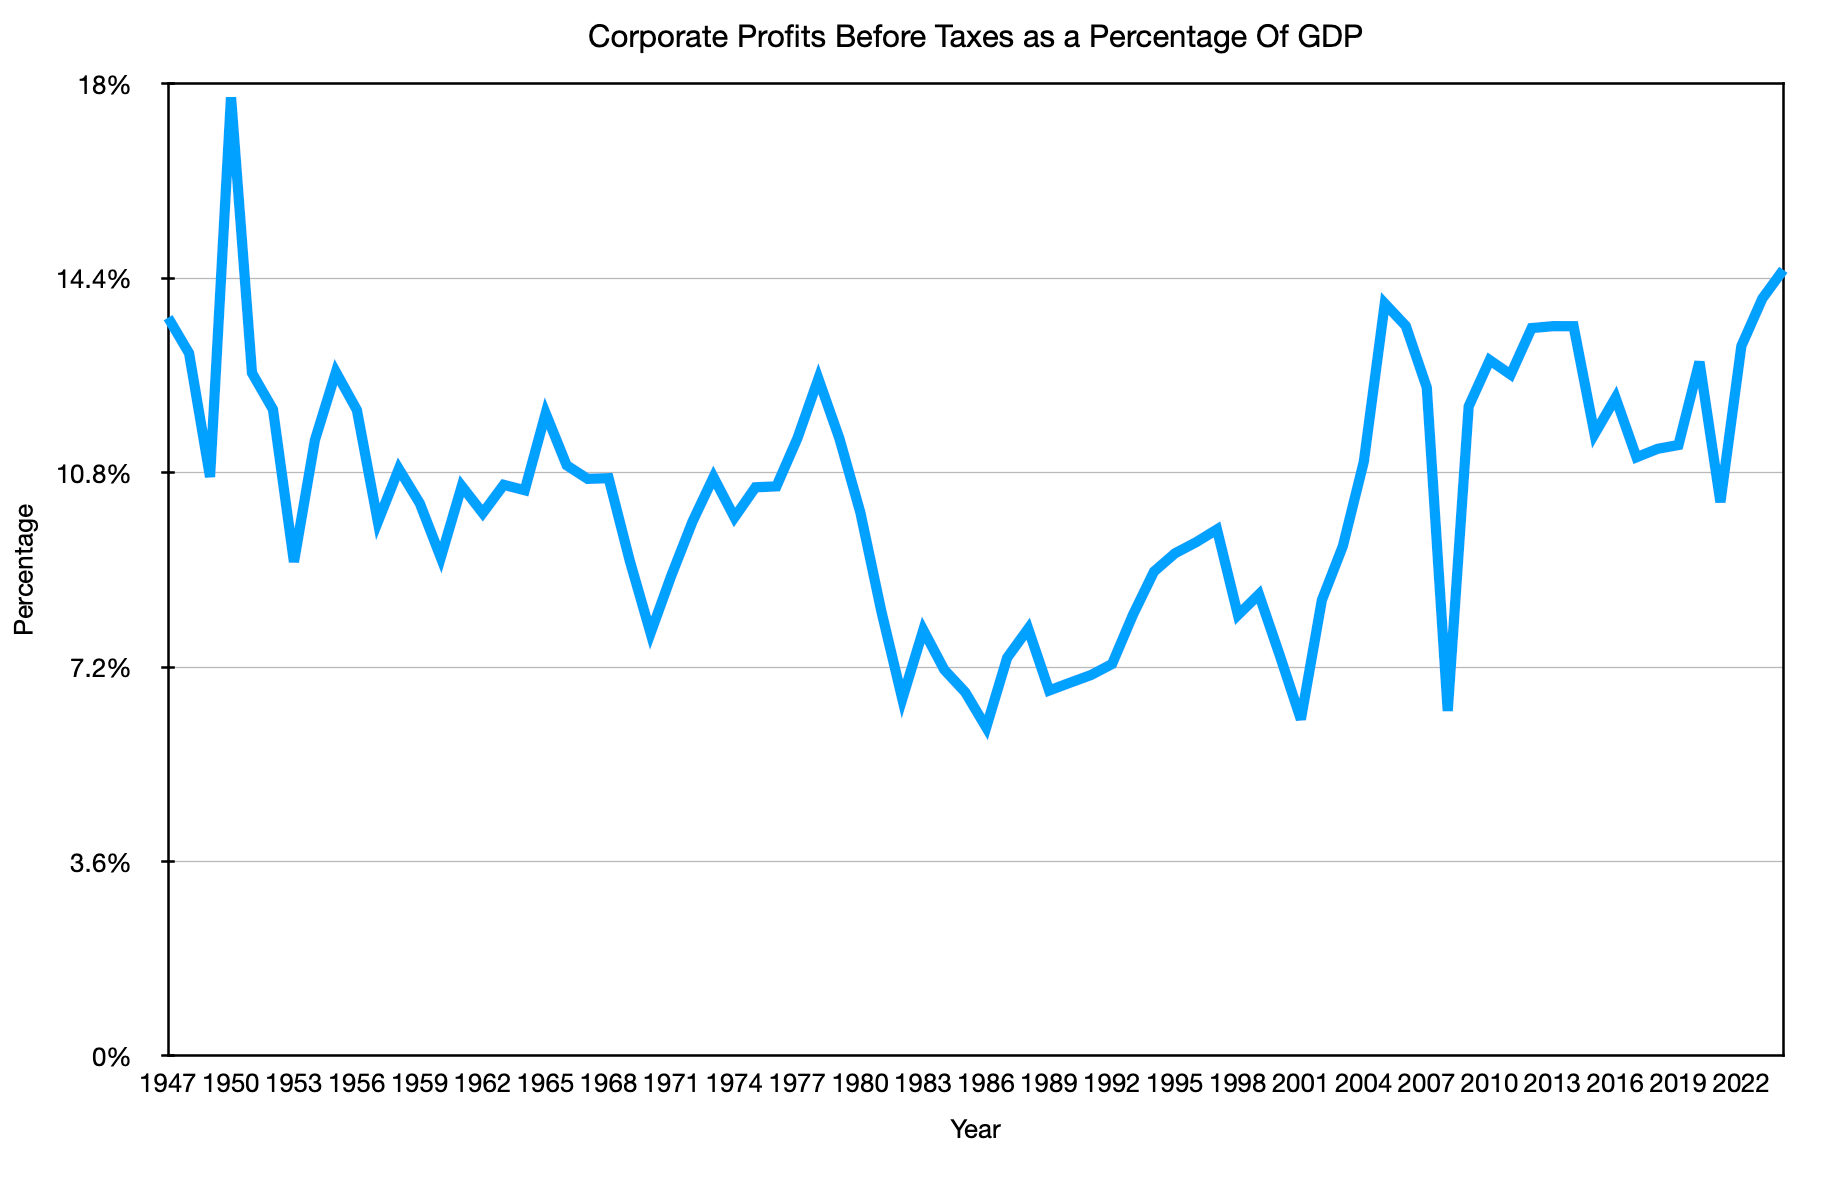
If corporations were single-handedly causing a new inflation regime, you’d expect the profit share of GDP to explode. Instead, it wiggles within a band while the value of the measuring unit (the dollar) quietly decays faster than CPI admits.
Firms are doing what households do:
Trying to survive under a mismeasured inflation regime.
Using CPI-linked metrics for raises, contracts, and planning, while the shadow 1.5% drift keeps eating away at everyone’s real position.
They’re not innocent, but they’re operating inside the same broken yardstick.
The felt economy is the real signal
When you put all this together, the story looks like this:
Your sense that “the numbers don’t match my life” is correct.
A century‑scale 1.5% understatement in inflation is enough to flatten the official growth miracle into something much closer to a sideways line on a per-person basis.
Once you fix the ruler, Big Macs behave as you’d expect after a productivity boom, wages behave as your parents and grandparents describe, and “needs vs wants” finally explains why you feel squeezed and surrounded by cheap stuff at the same time.
The felt economy—how far your time and paycheck actually go—is not a fuzzy, emotional overreaction. It’s the ground truth that the measured economy has been drifting away from ever since CPI started missing that 1.5% a year.
NETS is about closing that gap: putting human time back at the center of the system so the charts and your grocery bill finally tell the same story.
Next: Nowhere does this gap show up more painfully than at the grocery store. Continue to "Why Food Has to Be Cheap for Everything Else to Exist."
References
U.S. Bureau of Labor Statistics. (n.d.). Consumer Price Index for All Urban Consumers (CPI-U) [Data set]. https://www.bls.gov/cpi/
Social Security Administration. (n.d.). National Average Wage Index (AWI). Office of the Chief Actuary. https://www.ssa.gov/oact/cola/AWI.html
U.S. Bureau of Economic Analysis, National income: Corporate profits before tax (without IVA and CCAdj) [A053RC1Q027SBEA], retrieved from FRED, Federal Reserve Bank of St. Louis; https://fred.stlouisfed.org/series/A053RC1Q027SBEA, February 4, 2026.
U.S. Bureau of Economic Analysis, Gross Domestic Product [GDP], retrieved from FRED, Federal Reserve Bank of St. Louis; https://fred.stlouisfed.org/series/GDP, February 4, 2026.
Author: Kyle Novack
March 8, 2026
A Monumental Venture, LLC: research project (Novack Equilibrium Theory – NETs)
Attribution Required: © 2025–2026 Kyle Novack / Monumental Venture, LLC. For educational use with credit; commercial use requires permission. Full details in linked PDFs.