
What Is CPI, and Why Does It Run the Economy?
CPI Series Part 1 — Understanding the Ruler Before We Question It

Every month, the U.S. Bureau of Labor Statistics (BLS) releases a number that moves markets, shapes political careers, and determines how much of a raise millions of Americans will get. The Federal Reserve uses it to decide whether to raise or cut interest rates. Social Security checks are adjusted by it. Government bonds are priced against it. It is embedded in more contracts, policies, and financial decisions than almost any other single figure in the American economy.
That number is the Consumer Price Index (CPI), and it is baked into more economic decisions than most people realize. Other measures exist: the Personal Consumption Expenditure index (PCE), which the Federal Reserve prefers for monetary policy, and the GDP Deflator, calculated by the Bureau of Economic Analysis. But at the level of fiscal policy, public understanding, and the sheer number of decisions it powers, no single measurement rivals CPI. The reason is straightforward: without adjusting for inflation, historical nominal figures are almost useless for identifying trends. CPI is what makes that adjustment possible.
Understanding why CPI matters is only the first step. The next step is learning the methodology behind its calculation, because that methodology reflects a genuine attempt to grapple with one of the hardest problems in economics: how do you accurately measure the cost of living for an entire country when that economy is constantly shifting beneath you? CPI is not a single price or a simple average. It is the result of hundreds of thousands of data points, careful statistical decisions, and methodological choices that the BLS has refined over decades. When someone on the news says ‘inflation came in at 3.2%,’ there is an enormous amount of machinery behind that sentence that never gets explained.
This article is about that machinery. Before we can meaningfully ask whether CPI is accurate, and in later parts of the NETs project, I will ask that hard question, but first, we need to understand what it is trying to do and how it goes about doing it. You cannot critique a ruler without first understanding how it was built.
So let’s open the hood.
Before we do, one quick note on sources: all data, figures, and methodology described in this article are drawn directly from the U.S. Bureau of Labor Statistics Handbook of Methods, the primary document the BLS publishes explaining how CPI is built.
What Is the Consumer Price Index?
According to the U.S. Bureau of Labor Statistics, which calculates and publishes the index, the CPI measures the average change over time in the prices of a market basket of consumer goods and services. In plain terms, it tracks how much more or less expensive everyday life is getting.
There are actually several versions of CPI, each designed to measure inflation for a specific group or purpose. The three main ones are:
CPI-U (CPI for All Urban Consumers): the broadest and most widely cited version, covering about 93% of the U.S. population.
CPI-W (CPI for Urban Wage Earners and Clerical Workers): a narrower version used primarily to calculate Social Security cost-of-living adjustments.
C-CPI-U (Chained CPI for All Urban Consumers): a more flexible version designed to account for the fact that consumers shift their buying habits when prices change.
In this article, we focus exclusively on CPI-U. It is the index most people are referring to when they say “CPI,” the one used for most inflation adjustments, and the one that sits at the center of the debates we will examine in later parts of the Nets Project.
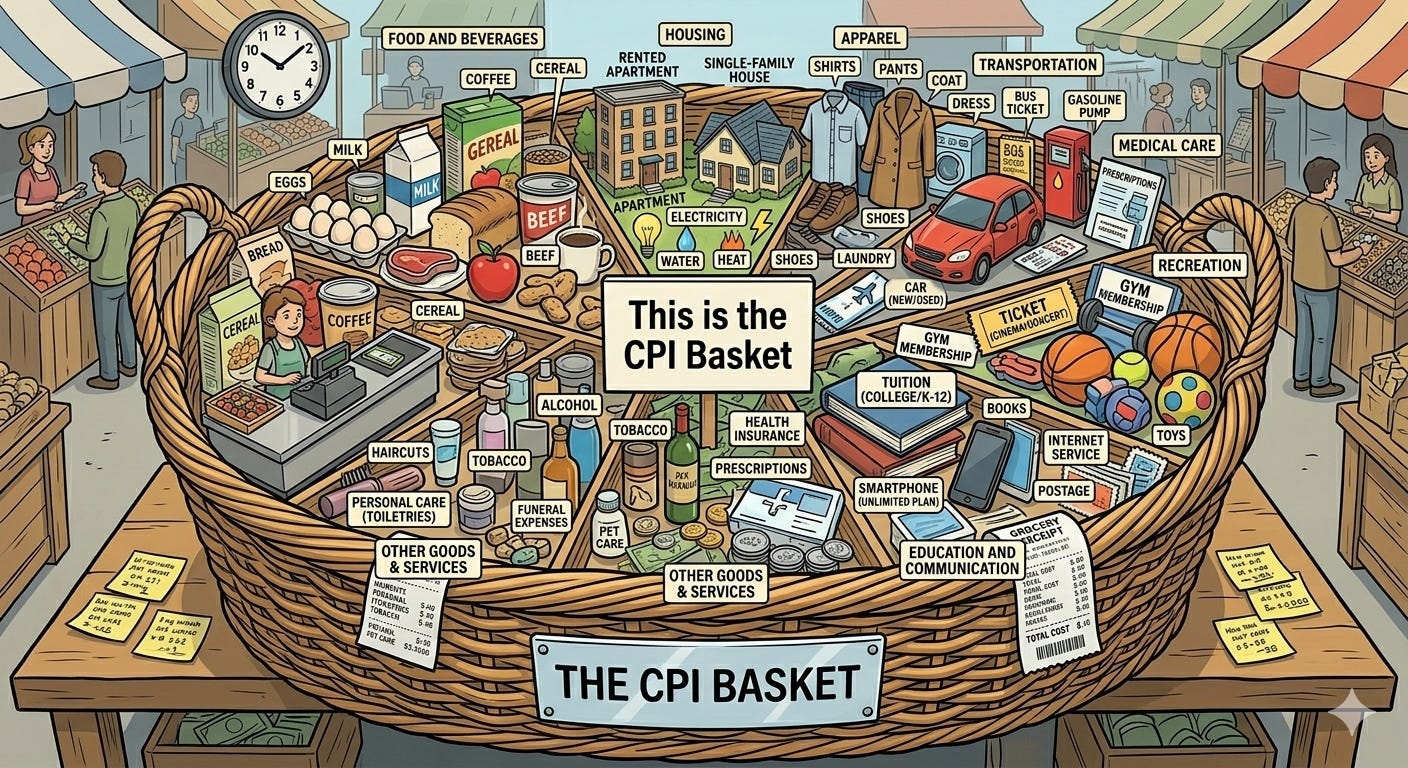
The Basket of Goods
The foundation of CPI is the market basket, a representative sample of the goods and services that American households buy. To account for the fact that prices vary significantly across the country, the BLS collects data from 75 urban areas, ensuring that regional differences in the cost of living are reflected in the sample rather than obscured. From those areas, the BLS constructs this basket using about 100,000 price quotes for goods and services and 8,000 rental housing unit quotes, organized into more than 200 categories across eight major groups:
Food and Beverages: breakfast cereal, milk, coffee, chicken, wine, full-service meals, snacks
Housing: rent, owners’ equivalent rent (an estimate of what homeowners would pay to rent their own home), utilities, furniture
Apparel: men’s shirts, women’s dresses, baby clothes, shoes, jewelry
Transportation: new vehicles, airline fares, gasoline, auto insurance
Medical Care: prescription drugs, physician services, eyeglasses, hospital services
Recreation: televisions, toys, pets, sports equipment, museum admissions
Education and Communication: college tuition, telephone services, computer software
Other Goods and Services: tobacco, haircuts, funeral expenses
This basket is not fixed forever. The BLS regularly reviews and updates the categories and items it tracks to ensure they reflect how Americans actually spend money today. If streaming services have replaced DVD players, or if a new category of spending has emerged, the basket should reflect that reality. The goal is simple: measure what people are actually buying, not what they bought a decade ago.
Weighting: Not Everything Counts Equally
Once the basket is defined, the BLS conducts surveys across those 75 geographic regions, as determined by the 2010 census, to determine how much of their income households spend in each category. This produces a weight for each group, which determines how much that category can move the overall index.
To make this concrete: in the September 2025 CPI report,
Weights of Different Categories:
Shelter: 35.471
Food: 13.646
Transportation: 7.247
What that means in practice is that even if transportation costs rose 2.3% in a given year, the contribution of that increase to the overall CPI number is only about 0.2 percentage points, because transportation simply does not make up a large enough share of the average household budget to move the needle much. Shelter, by contrast, is so heavily weighted that even a modest rent increase ripples through the entire index.
Starting in 2023, the BLS began updating these expenditure weights annually, adjusting how much each category counts toward the index to better reflect shifting consumer habits. This was itself a response to longstanding criticism that infrequent weight updates allowed the index to drift out of sync with how people spend money. Even with this change, the weighting system is still one of the most consequential and most debated aspects of how CPI is built. We will come back to it.
What CPI Actually Measures: Changes, Not Prices
Here is something that surprises most people: CPI doesn’t report raw shelf prices; it reports how those prices change over time, combined into a single index
The reason is straightforward. A pound of ground beef costs more in San Francisco than it does in rural Mississippi. If the BLS tried to compare raw prices across the country, regional cost differences would create enormous distortions. Instead, they record the percentage change in price from one period to the next within each region. If ground beef costs $4.00 in 2024 and $5.00 in 2025 in a given market, CPI records a 25% price increase — regardless of whether the underlying price is higher or lower than the national average.
This is an elegant solution to a real problem. But it also means CPI is measuring a rate of change, not an absolute level of affordability. That distinction matters more than it might seem, and we will return to it in a later article.
Quality Changes and Hedonic Adjustments
One of the more technically sophisticated and more controversial things CPI does is adjust for quality changes in the goods it tracks.
Consider a simple example: a box of cereal that was 20 ounces last year is now 16 ounces but costs the same price. The sticker price hasn’t changed, but you are getting less product. CPI will recognize this and adjust, recording an effective price increase even though the number on the shelf stayed the same. This is called a quantity adjustment, and it is uncontroversial.
More complex is what happens when a product genuinely improves. Say a manufacturer discontinues a shirt and replaces it with one made from a higher-quality material at the same price. The BLS has to decide: is the consumer getting more for their money? If they conclude the new shirt is better, they may record zero inflation, or even deflation, on that item, because the quality-adjusted price effectively went down.
Technology is where this gets especially pointed. If a laptop goes from $1,000 to $1,200 but the new model has a faster processor, double the RAM, and 250 gigabytes of additional storage, the BLS may determine that the price increase is fully offset, or more than offset, by the quality improvement. In that case, CPI records zero price increase, or possibly a price decrease, even though you paid $200 more at the register. This method is called a hedonic adjustment, and it is one of the most debated tools in CPI’s methodology.
Whether hedonic adjustments are the right approach is a legitimate debate. For now, the key point is that CPI is not simply reading price tags; it is making judgment calls about value, quality, and equivalence constantly.
A Common Misconception About Substitution
One of the most frequently repeated criticisms of CPI is that it allows substitutions that obscure real inflation: if steak gets too expensive, the BLS just assumes people switch to chicken and calls it a day. This makes CPI sound like it is gaming the numbers to report lower inflation than people experience.
This is worth correcting directly, because it is not accurate for CPI-U.
CPI-U does allow within-category substitutions; if consumers shift from buying ground chuck to ground round, for example, the index can reflect that. But it does not allow cross-category substitutions. If beef prices spike, CPI does not assume people are now buying chicken instead and adjust accordingly. Beef and chicken are in different categories, and the index treats them separately.
This is a meaningful distinction. The criticism applies more accurately to the Chained CPI (C-CPI-U), which is specifically designed to account for broader substitution behavior. CPI-U, the standard index, does not work that way.
A Valiant Attempt at an Impossible Task
Step back and look at what CPI is trying to do: take a constantly changing economy, new products, disappearing products, shifting consumer habits, improving technology, and regional price differences, and distill all of it into a single number that represents how much more expensive life is getting for a typical American. Not just once, but every month. And reliable enough that the Federal Reserve will base its interest rate decisions on it.
That is an enormously ambitious undertaking. And the BLS, for what it is worth, does not pretend it is perfect. The methodology has been refined repeatedly over decades, and the economists who build and maintain CPI are aware of its limitations. They have published extensively on where the index struggles.
But understanding what CPI is trying to do and appreciating the genuine difficulty of the problem are the necessary first steps before asking whether it succeeds. Because the next question, the one this series is ultimately building toward, is a serious one: what happens if this number, the number at the foundation of so much of our economic understanding, is consistently and systematically off?
To get there, we first need to understand just how hard the problem of measuring inflation really is, not in abstract terms, but in a way that makes the difficulty feel real.
That is what Part 2 is for: we examine this through Grandma’s amazing chocolate cake recipe.
Next: Understanding what CPI does is one thing. Understanding why getting it exactly right may be impossible is another. Continue to "Why Measuring Inflation Is Like Baking Grandma's Chocolate Cake."
Sources
U.S. Bureau of Labor Statistics. (2025, October 24). Consumer price index summary. U.S. Department of Labor. https://www.bls.gov/news.release/archives/cpi_10242025.htm
U.S. Bureau of Labor Statistics. (2025). Handbook of methods: Consumer price index. U.S. Department of Labor. https://www.bls.gov/opub/hom/cpi/home.htm
Author: Kyle Novack
May 5, 2026
A Monumental Venture, LLC: research project (Novack Equilibrium Theory – NETs)
Attribution Required: © 2025–2026 Kyle Novack / Monumental Venture, LLC. For educational use with credit; commercial use requires permission. Full details in linked PDFs.