
Why Agriculture Is the Perfect Smoking Gun
Food Puzzle: Part 1

Agriculture is as close as economics ever gets to a laboratory experiment. We have over a century of exceptionally detailed USDA data on output, acres, labor, capital costs, intermediate inputs, and total factor productivity. All are built on consistent methods and carefully maintained time series. Most sectors can only dream of that kind of statistical backbone.
Even better, the product itself barely changes. A pound of wheat is still a pound of wheat. A bushel of corn is a bushel of corn. Calories from basic staple crops deliver essentially the same nutrition today that they did in 1910. We do not need to argue about whether a 1910 smartphone is “comparable” to a modern one, or whether new features justify higher prices. The output is measured in raw physical units.
On the demand side, everyone in the country participates in the food economy. Every American either helps produce food or buys it, so converting the entire system to per-capita terms does not distort the story the way it might in a niche industry. When we say, “pounds of major crops per capita” or “farm expenses per capita,” we are describing how the food system interacts with every citizen, not just a sliver of the population.
That combination makes agriculture the ideal stress test for our inflation yardstick. The data are clean, the product is stable, and the market is universal. If an inflation measure cannot accurately capture the impact of a century-long productivity revolution in farming, where the goods are simple, and the inputs and outputs are precisely tracked, then the problem lies with the measure, not with the farms. Put bluntly: if our inflation gauge cannot tell the truth about food, it cannot be trusted anywhere.
How to Read the Data in This Post
All the charts and numbers in this article come from standard public data sets: USDA (NASS and ERS), official population estimates, historical GDP series, and labor‑force statistics. Citations in the main text are kept to a minimum; each figure has a short caption explaining how it was calculated and which datasets it uses. At the end of the post, a “Data sources” section lists all underlying series, so anyone who wants to audit or recreate the charts can do so.
The Physical Reality of Modern Farming
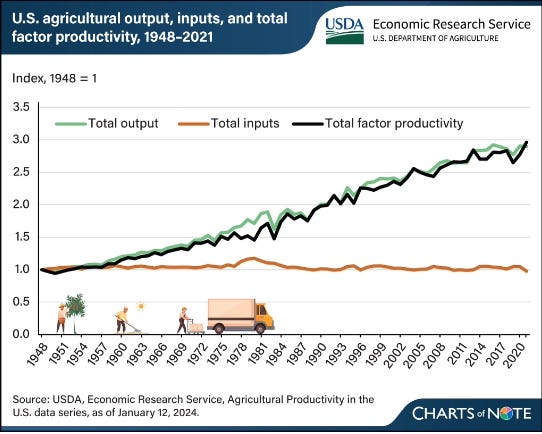
Over the past century, American farming has quietly become one of the most efficient systems humans have ever built. Economists track this using something called Total Factor Productivity (TFP), which measures how much output we get from all the main inputs together: land, labor, capital (machines and buildings), and materials like seed and fertilizer. In simple terms, if TFP goes up, it means we are producing more food from the same—or even fewer—resources.
On that score, agriculture has blown past almost every other sector. The USDA’s TFP index for U.S. farms rises from about 100 in 1948 to nearly 300 in recent years. Indicating that overall productivity has roughly tripled since the mid‑20th century. That abstract index shows up in the hard numbers when we compare 1910 to today. From here, I use 1910–2024 data for output, land, and labor because the official TFP series only begins in 1948. The reason it is important to go back as far as possible is that it makes the progress impossible to wave away. The further back we look, the more overwhelming the productivity gains become. This makes agriculture an even tougher stress test for how well CPI measures inflation.
Here is what changed between then and now:
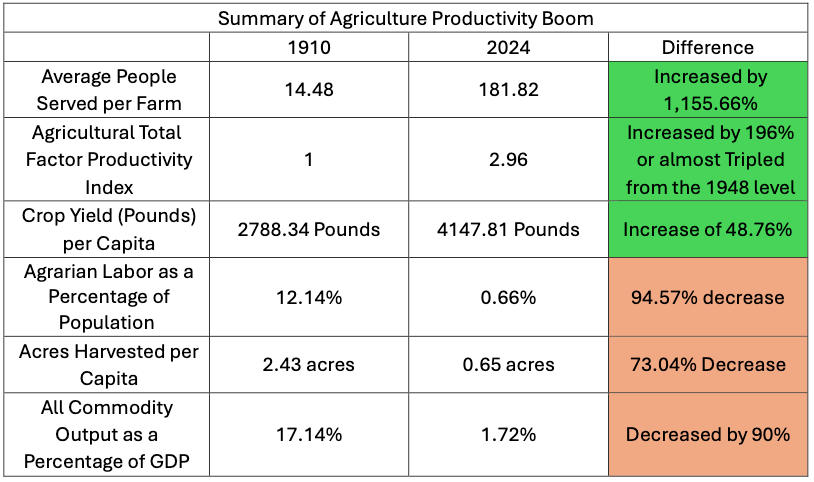
Food produced per person: For the ten major U.S. crops, total output jumped from about 250 billion pounds in 1910 to over 1.4 trillion pounds today. On a per‑person basis, that is an increase from roughly 2,790 pounds a year to more than 4,150 pounds—about 49 percent more staple food per American.
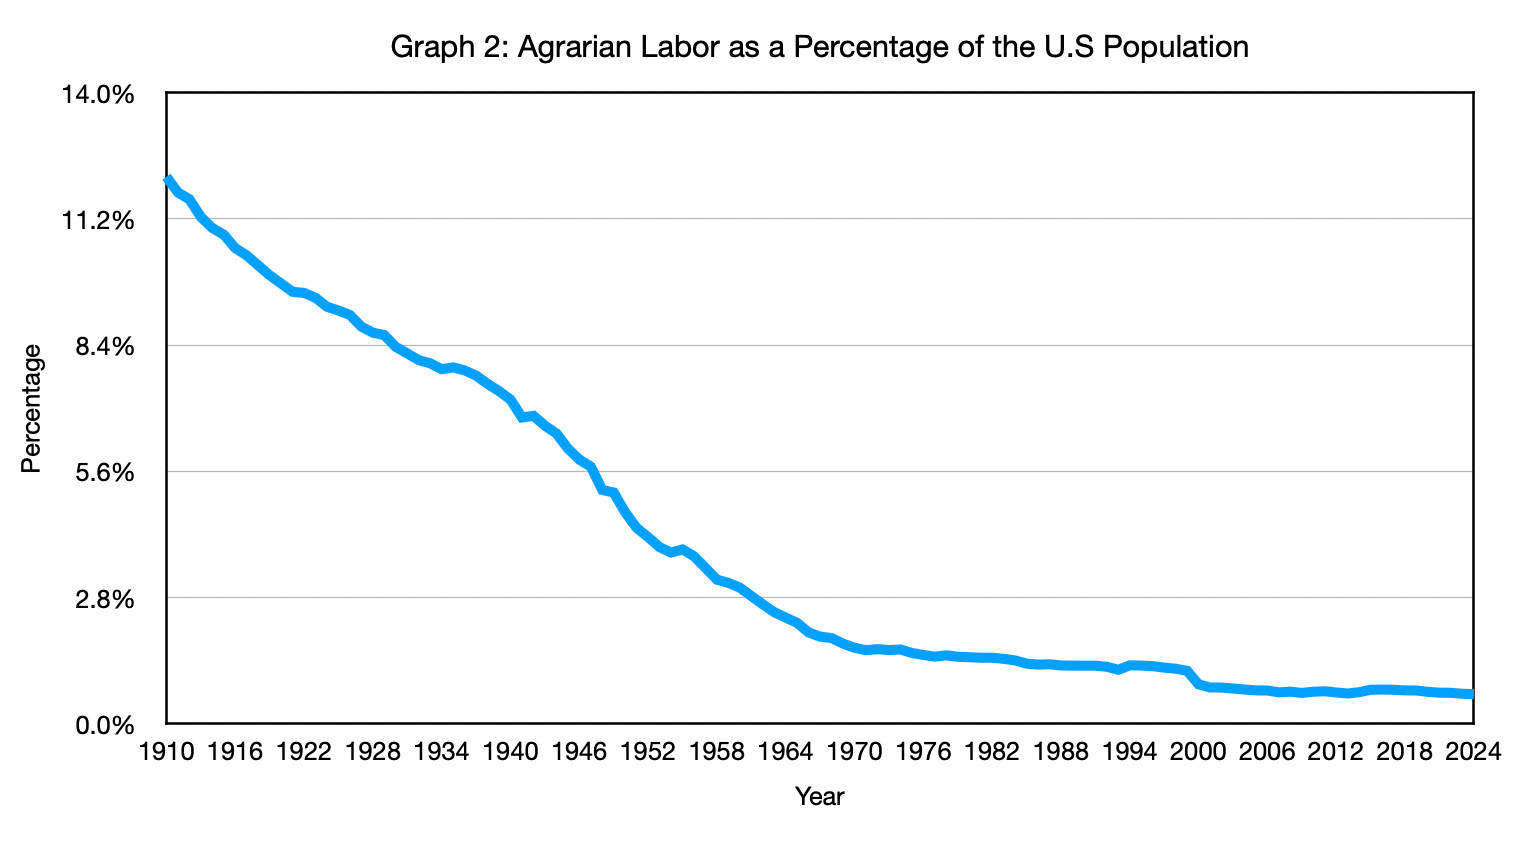
People working in farming: In 1910, about 12 percent of Americans—roughly one in eight—lived and worked on farms. Today, it is about 0.7 percent, roughly one in 150 people, a 94–95 percent drop in the share of the population tied directly to agriculture.
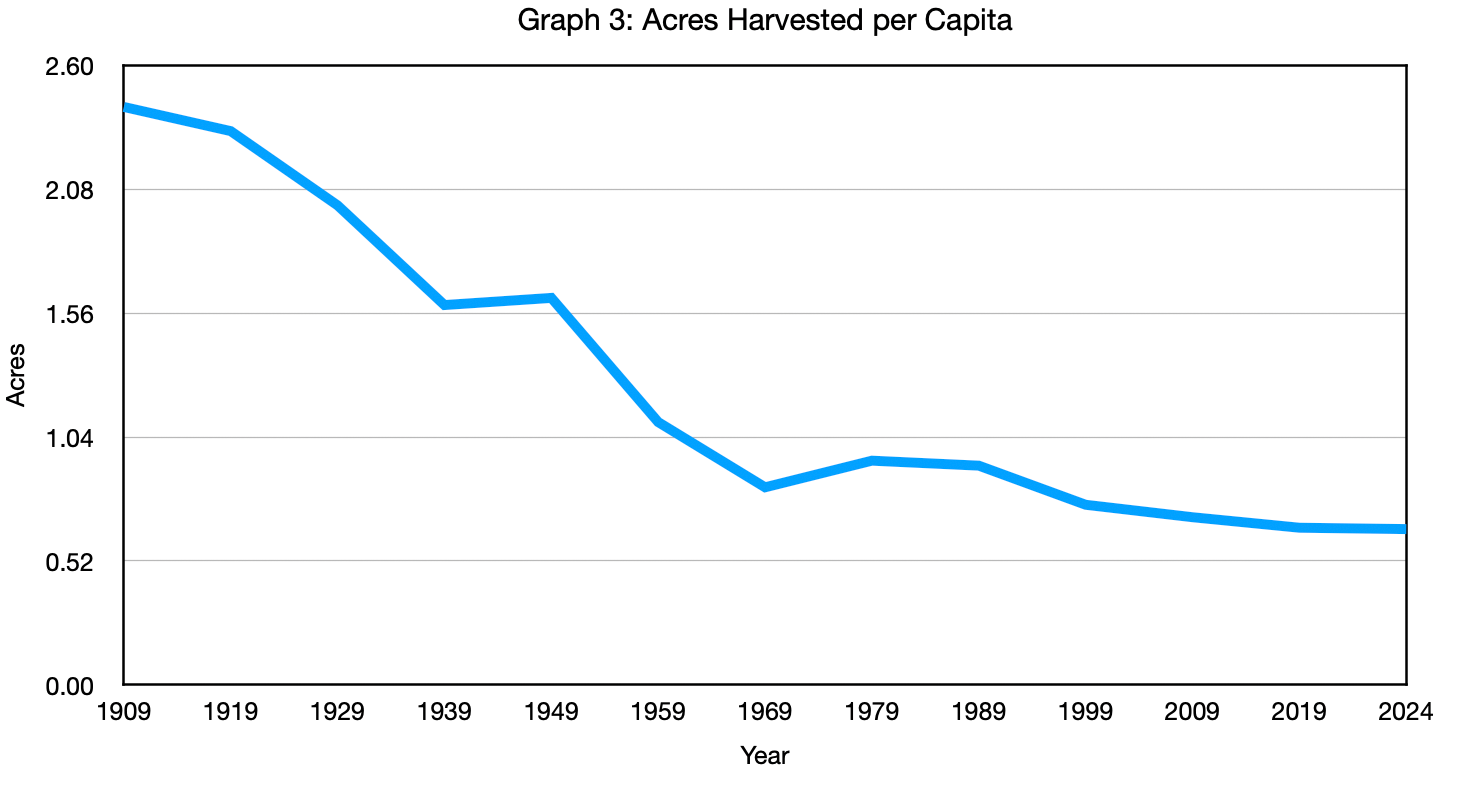
Land used per capita: In 1910, the U.S. harvested about 2.4 acres of cropland per capita for these major crops. Today, it is about 0.65 acres per person, a decline of roughly 73 percent, even though total harvested acres for these crops have stayed near 220 million for more than a century.
People fed by each farm: Around 1910, the average farm fed about 14.5 people. Basically, enough to feed the farm family itself and roughly one other household. Today, the average farm feeds roughly 182 individuals, a more than twelve‑fold increase.
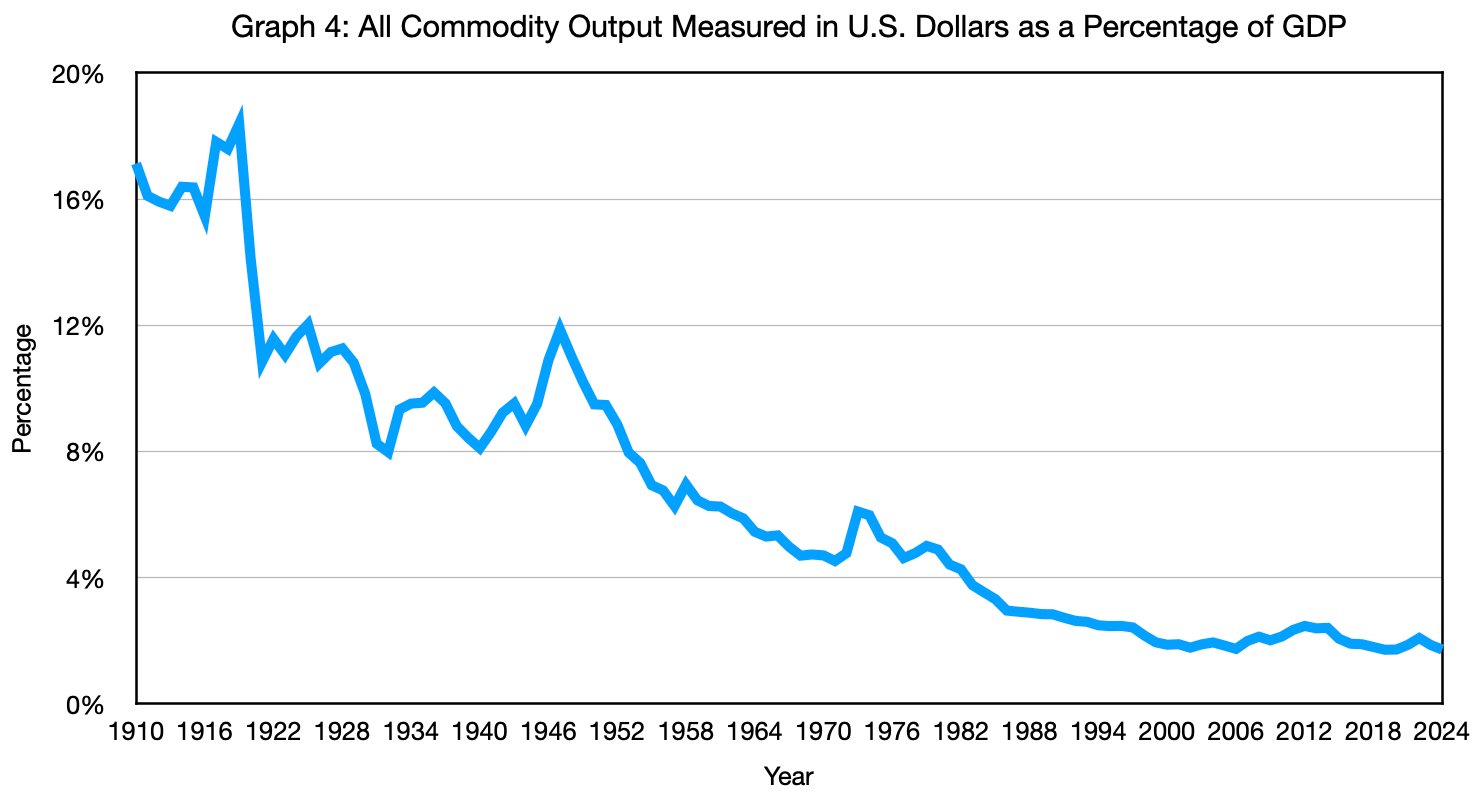
Share of the overall economy (as a percent of GDP): Farm commodity output fell from about 17 percent of U.S. GDP in 1910 to around 2 percent today, even as the physical supply of food surged.
Food has never been this abundant or this cheap relative to the rest of what we produce and buy. In a world without this agricultural miracle, the United States would be almost unrecognizable. Using 1910 technology to feed today’s population would require roughly 3.8 times as much cropland, some 831 million acres for the major crops alone. An area comparable to the entire landmass of India and about a third of all U.S. land. We would need on the order of 41 million farm workers, compared with about 2.2 million today. Meaning one in eight Americans would still be tied to farm work. Instead of freeing people to become engineers, teachers, nurses, and software developers, the country would be one vast farm barely keeping up with basic caloric needs.
To see the whole century in one snapshot, here’s what changed between 1910 and today.
Now that we’ve seen just how massive the productivity gains in farming are, we can ask a sharper question: how does this transformation show up in agricultural datasets measured in U.S. dollars? We know the physical reality of the last century, and our intuition says we’d expect the “real” price of farming to have collapsed right along with the land and labor it uses. Instead, once we put CPI on the case, the savings practically evaporate. In the next section, we’ll follow the trail of dollars—and see why every obvious place those savings should show up comes back empty.
Next: The physical story is clear. Now the dollar data needs to confirm it. Continue to “The Money World Paradox: Where Did All the Savings Go?”
Methods and Sources (Non‑Graphed Series)
Crop production in pounds: Yields in pounds per harvested acre (converted from bushels per acre using standard USDA weights where applicable) multiplied by harvested acreage in acres, summed across barley, corn/maize, cotton, oats, rice, soybeans, sugarbeets, sugarcane, tobacco, and wheat. Sources: USDA National Agricultural Statistics Service, Crop Production 2022 Summary and Crop Production 2024 Summary (historical tables on yields and harvested acreage); population series from Bolt and van Zanden (2024) and Macrotrends.
Crop pounds per capita: Aggregate crop production in pounds divided by total U.S. population; same sources as above
Harvested acres: Aggregate harvested acreage (barley, corn/maize, cotton, oats, rice, soybeans, sugarbeets, sugarcane, tobacco, wheat) from USDA NASS Crop Production summaries
Sources
Bolt, J., & van Zanden, J. L. (2024). Maddison style estimates of the evolution of the world economy: A new 2023 update. Journal of Economic Surveys. Advance online publication. https://doi.org/10.1111/joes.12618
Macrotrends. (n.d.). United States population 1950–2025. Retrieved March 14, 2026, from https://www.macrotrends.net/global-metrics/countries/usa/united-states/population
MeasuringWorth. (2025). What was the U.S. GDP then? Retrieved March 14, 2026, from https://www.measuringworth.org/usgdp
· Statista. (2025). United States agricultural and nonagricultural labor force, 1900–1970 [Data set]. Retrieved March 14, 2026, from https://www.statista.com/statistics/1316855/us-farm-nonfarm-labor-force-historical/
· U.S. Bureau of Economic Analysis. (2025). Gross domestic product, billions of dollars, annual (Series GDP) [Data set]. Federal Reserve Bank of St. Louis (FRED). Retrieved March 14, 2026, from https://fred.stlouisfed.org/series/GDP
· U.S. Bureau of Labor Statistics. (2025). Employment level – Agriculture and related industries (Series LNS12034560) [Data set]. Federal Reserve Bank of St. Louis (FRED). Retrieved March 14, 2026, from https://fred.stlouisfed.org/series/LNS12034560
· U.S. Department of Agriculture, Economic Research Service. (n.d.). Agricultural productivity in the U.S.: Summary of recent findings. Retrieved March 14, 2026, from https://www.ers.usda.gov/data-products/agricultural-productivity-in-the-united-states/summary-of-recent-findings
U.S. Department of Agriculture, Economic Research Service. (n.d.). Farm income and wealth statistics: Annual cash receipts by commodity [Data set]. Retrieved March 14, 2026, from https://data.ers.usda.gov/reports.aspx?ID=4055
U.S. Department of Agriculture, National Agricultural Statistics Service. (2023). Crop production 2022 summary (January 2023, ISSN 1936–3737). https://www.nass.usda.gov/Publications/Todays_Reports/reports/croptr22.pdf
U.S. Department of Agriculture, National Agricultural Statistics Service. (2025). Crop production 2024 summary (January 2025, ISSN 1936–3737). Cornell University Library. https://downloads.usda.library.cornell.edu/usda-esmis/files/k3569432s/nk324887m/qn59s0097/cropan25.pdf
U.S. Department of Agriculture, National Agricultural Statistics Service. (n.d.). Quick Stats database: Farms – Number of operations – United States [Data set]. Retrieved March 14, 2026, from https://quickstats.nass.usda.gov/#EA91AED4-C137-3251-B480-328DFF9768B3
Author: Kyle Novack
March 17, 2026
A Monumental Venture, LLC: research project (Novack Equilibrium Theory – NETs)
Attribution Required: © 2025–2026 Kyle Novack / Monumental Venture, LLC. For educational use with credit; commercial use requires permission. Full details in linked PDFs.
This is the kind of essay I enjoy because it starts with something concrete.
A field.
A tractor.
A harvest.
You can argue ideology all day, but a bushel of wheat either exists or it doesn’t.
What stayed with me wasn’t the specific conclusion so much as the question underneath it:
If we have become astonishingly productive as a society, why do so many people feel as though they are working harder just to stay afloat?
Agriculture is an interesting lens because the gains are undeniable. One farmer can now produce what once required many hands. The miracle happened.
So where did the abundance go?
I don’t think any single factor explains a civilization. Reality is usually messier than that. But I do think many people feel a growing disconnect between what we are capable of producing and what ordinary life feels like.
The question is worth asking.
Not because nostalgia has the answer.
But because a society should occasionally stop, look at the harvest, and ask who is eating well, who is hungry, and where everything in between is going.