
Why an Iran War Oil Shock Won’t Bring Back Inflation
NETs Predictions: Oil spikes reshuffle spending and test fragile economies, but only an accommodating monetary regime turns them into true, sustained inflation.


Every time oil prices spike, the same story resurfaces: “Here comes inflation, here comes recession, and here’s the single culprit—oil.” It is an appealing narrative because it is simple, visual, and painful at the pump. But as soon as you look closely at the history, that story breaks down. Big oil moves are common; generalized, persistent inflation regimes are rare. The difference is not the barrel of oil. The difference lies in the background monetary and macroeconomic environment.
The core claim of this essay is straightforward: oil shocks are primarily relative‑price and real‑income shocks. They reshuffle who spends what and where within a fixed nominal envelope. They can certainly hurt growth and employment, and they can absolutely show up as temporary bumps in headline inflation. But they do not, by themselves, create a self-sustaining inflation regime. For that, you need an accommodating monetary framework and unanchored expectations that allow a one-time jump in energy prices to cascade through the entire price system.
The car on the hill: timing versus cause
A more accurate way to think about oil shocks is as a stress test on an engine that is already under strain. Imagine a car towing a heavy trailer up a long hill with the check‑engine light on, low oil, and an audible knock coming from the engine. When the engine finally blows on a small incline, you could say “the hill killed the car,” but that misses the truth. The breakdown was coming either way; the hill just determined when and where it happened.
Macro history looks similar. By the time an “oil crisis” hits the headlines, the economic engine is usually already running hot: leverage is elevated, asset prices are stretched, policy is boxed in, and key sectors are fragile. In that environment, a sharp rise in oil prices is less a lone assassin and more the last pothole on a badly maintained road. The shock helps choose the date and storyline of the recession, but the underlying conditions are what make a downturn almost inevitable—with or without an oil headline to blame.
What the data since 1970 show
Once you line up actual chronologies of inflation and recessions against oil spikes, the pattern is hard to dismiss. In the classic high-inflation 1970s episodes, oil shocks coincided with already rising inflation and weak monetary credibility. The 1973-74 Arab embargo and the 1979–80 Iranian Revolution hit an economy where prices were already accelerating, and monetary credibility was weak. In 1973–74, prices almost quadrupled, from about $3.50 to over $11 per barrel. In 1979–80, they rose from roughly $15 to nearly $40, an increase of more than 160%. Energy shocks didn’t start the fire; they poured gasoline on a house that was already in flames. You might see the flames flare higher at the margins, but the underlying damage was baked in before the oil headlines.
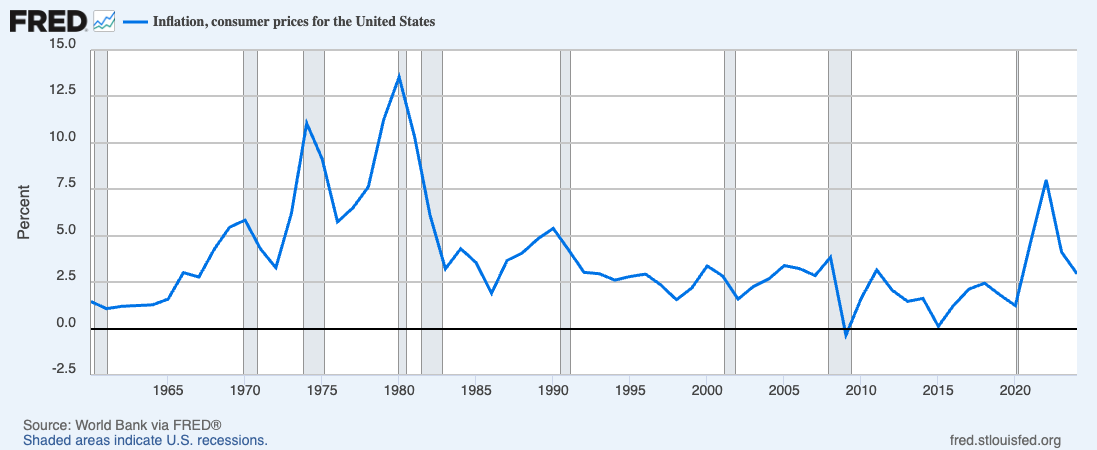
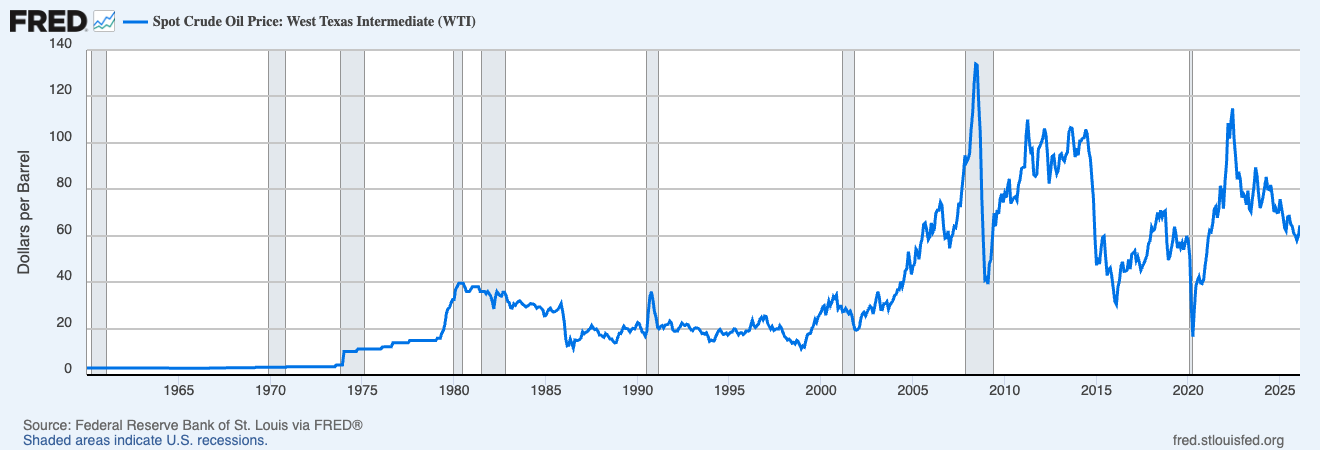
But there are equally large, or larger oil moves in low‑inflation environments where the feared runaway inflation never arrives. The 1990 Gulf episode, the late-1990s/early-2000s run-up, and the 2003–08 “super‑spike,” all involved large swings in oil prices. In 1990, during the Gulf episode, prices jumped from roughly $18–$19 to the mid-30s, a move of about 80–90%. From 1999 to 2000, they climbed from about $12 at the start of 1999 to around $34 by late 2000. In the 2003–08 ‘super‑spike,’ prices rose from the low-30s to roughly $130–$140 by mid-2008. Yet in each of these cases, we see contained inflation with anchored expectations. In several episodes, recessions start before oil peaks, or oil peaks well into a downturn driven by other structural forces.
Most recently, we saw this during the COVID recovery and the Ukraine–Russia war. As the economy reopened and then war disrupted energy markets, U.S. gasoline prices surged, with the national average for regular hitting about 5 dollars per gallon in June 2022. Before the invasion, benchmark crude was already around 80–85 dollars per barrel in January 2022 and peaked near 115 dollars that June, a rise of roughly 30–40 percent on top of the post‑COVID climb from 2020 lows. That spike likely added to short‑term price pressure, but it did not start the inflation episode. Inflation was already running hot through 2021, with year‑over‑year CPI above 5 percent by mid-2021 and around 7 percent by year’s‑end. Over 2020–2021, M2 money supply per person jumped by nearly 40 percent, while the cumulative CPI increase from 2020 to today remains below that, even after the oil shock. In other words, the war-driven oil spike poured more fuel on a fire that massive pandemic-era money growth and policy choices had already lit; markets are still working through that underlying COVID-era distortion, not a one-off gas-price story.
The magnitude and reallocation problem
There is also a simple arithmetic constraint that the standard narrative tends to skip over. Oil and gas are a small slice of value added in a modern economy—on the order of a few percent of GDP. Even if you assume an extreme scenario where oil prices double, quantities do not adjust, and firms pass everything through, the mechanical contribution to the overall price level is only a few percentage points, and that is a one-time level shift, not a permanent trend. Once you allow for quantity responses and for households to cut other spending to pay higher fuel bills, the impact on aggregate prices is smaller and fades out over time.
This is the reallocation story: higher oil prices act like a tax on consumers and firms. They reduce real disposable income and force a shift in spending away from other goods and services. Empirical work finds exactly this pattern. Sill, at the Philadelphia Fed, shows that oil run‑ups cut real output growth through a tax‑like effect and costly reallocation, with only modest and temporary pass‑through to inflation unless policy accommodates it. Hunt, Isard, and Laxton’s IMF simulations treat higher oil prices as a negative supply and terms‑of‑trade shock that lowers real activity across countries, and they explicitly find that persistent inflation arises only when monetary policy allows the shock to feed into core prices. Herrera, Karaki, and Rangaraju likewise show that oil shocks mainly reduce durables spending and trigger sectoral reallocation, especially in energy‑intensive sectors, rather than serving as an independent engine of sustained high inflation. Even the San Francisco Fed’s ‘Doctor Econ’ column describes higher oil prices for households as a tax and emphasizes that with credible policy, inflation expectations and core inflation can remain anchored despite large moves in energy. Put differently, you cannot consistently say ‘oil shocks squeeze demand’ and ‘oil shocks themselves are the driver of persistent inflation’ without specifying the monetary regime that makes both claims true (Federal Reserve Bank of San Francisco, 2007; Herrera, Karaki, & Rangaraju, 2019; Hunt, Isard, & Laxton, 2001; Sill, 2007).
Why this matters for the current debate
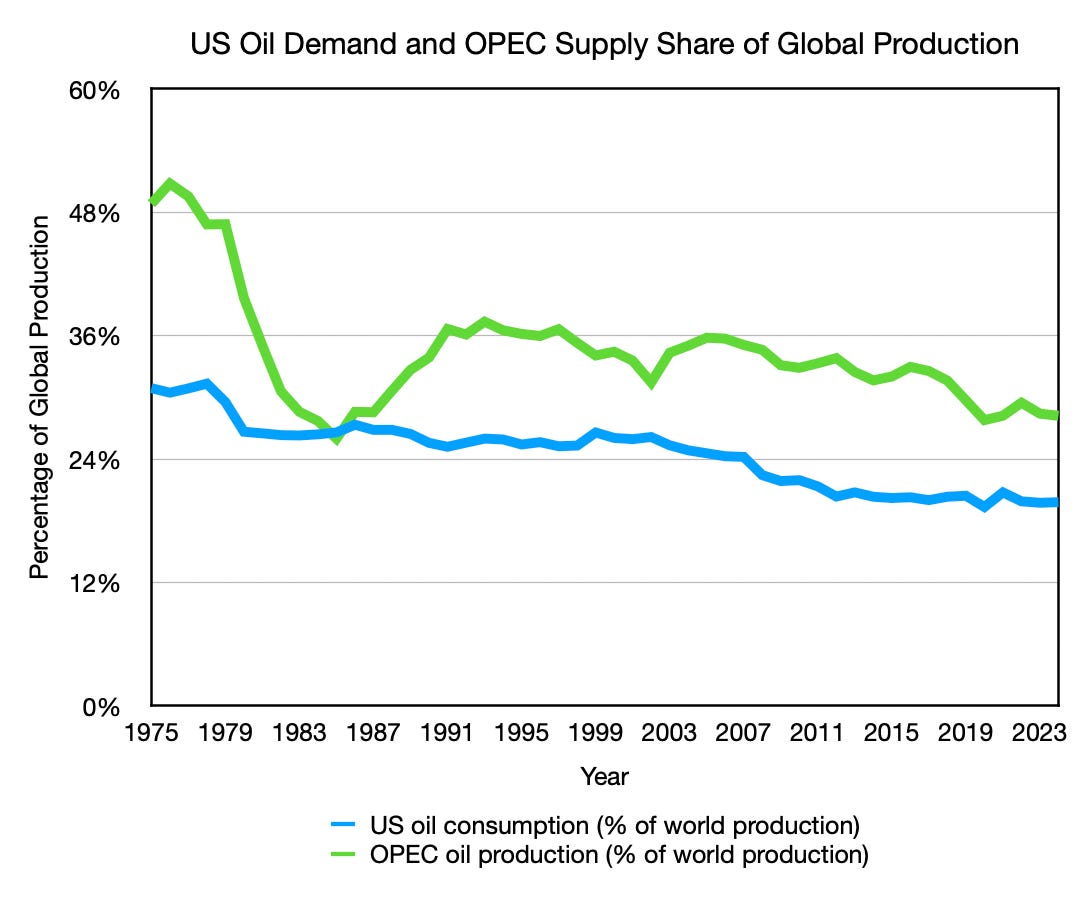
This distinction is not an academic quibble. World oil production has almost always increased, with the U.S. consuming a smaller share of global oil output and OPEC controlling a smaller share of supply (Figure 3). There were also logistical disruptions, such as the 2021 Suez blockage, that did not trigger a runaway oil spiral. Treating every oil move as an inflation boogeyman, badly misreads the mechanics at work. It encourages policymakers and commentators to overattribute both recessions and inflation to energy, instead of to leverage, asset cycles, and the stance of monetary policy.
Oil prices obviously affect real people. If you have $100 to spend and your monthly energy bill rises from $8 to $12, you now have $4 less for everything else. That is a painful reallocation, but it is not inflation in the monetary sense; the nominal $100 has not changed. True inflation is what happens when that $100 becomes $110—because the money supply and credit system have expanded—and prices across the economy adjust upward to reflect more dollars chasing roughly the same amount of goods and services. Higher oil prices can change where your $100 goes, but only an underlying monetary expansion can reliably change what that $100 is worth.
This is not to downplay the strain on households and businesses; those effects are real. But we must stop blurring what is inflationary and what is not. Most people accept that there is ‘good’ deflation (innovation that lowers costs) and ‘bad’ deflation (a shrinking money supply). We should be just as precise on the upside. Temporary price spikes driven by market conditions or shocks are a different animal from broad, lasting increases driven by monetary expansion that raise the entire price floor. Until we make that distinction explicit, the average American will keep paying for crises and policy mistakes that all get dumped into the same “inflation” bucket.
For the full empirical case behind this analysis, the Food Puzzle series starts at “Why Agriculture Is the Perfect Smoking Gun.”
References
· California Energy Commission. (2007). Crude oil supply, prices, and exports (California crude‑oil market study). https://cdn.ca9.uscourts.gov/datastore/library/2013/02/26/California_crude-oil.pdf
· Federal Reserve Bank of San Francisco. (2007, October 31). What are the possible causes and consequences of higher oil prices on the U.S. economy? Doctor Econ.
· Federal Reserve Bank of St. Louis, Spot Crude Oil Price: West Texas Intermediate (WTI) [WTISPLC], retrieved from FRED, Federal Reserve Bank of St. Louis; https://fred.stlouisfed.org/series/WTISPLC, March 11, 2026.
· Herrera, A.M., Karaki, M. B., & Rangaraju, G. (2019). Oil price shocks and U.S. economic activity. Energy Policy, 129, 89–103.
· Hunt, B., Isard, P., & Laxton, D. (2001). The macroeconomic effects of higher oil prices (IMF Working Paper No.WP/01/14). International Monetary Fund.
· Sill, K. (2007). The macroeconomics of oil shocks. Business Review, Federal Reserve Bank of Philadelphia, Q1, 21–31.
· U.S. Energy Information Administration. (n.d.). International: Petroleum and other liquids production (monthly/quarterly data). https://www.eia.gov/international/data/world/petroleum-and-other-liquids/monthly-petroleum-and-other-liquids-production
· World Bank, Inflation, consumer prices for the United States [FPCPITOTLZGUSA], retrieved from FRED, Federal Reserve Bank of St. Louis; https://fred.stlouisfed.org/series/FPCPITOTLZGUSA, March 11, 2026.
· Worldometer. (n.d.). United States oil. https://www.worldometers.info/oil/us-oil/
· YCharts. (n.d.). OPEC crude oil production (annual). Retrieved March 11, 2026, from https://ycharts.com/indicators/opec_crude_oil_production_annual
Author: Kyle Novack
March 8, 2026
A Monumental Venture, LLC: research project (Novack Equilibrium Theory – NETs)
Attribution Required: © 2025–2026 Kyle Novack / Monumental Venture, LLC. For educational use with credit; commercial use requires permission. Full details in linked PDFs.