
Why Severe Understatement of Inflation Goes Too Far
Food Puzzle: Part 12

Having seen that the Boskin Commission’s “CPI is too high” correction makes the Food Puzzle worse, the natural next question is what happens when CPI understates inflation instead. That is the story told by ShadowStats and the Chapwood Index, which have become two of the most widely cited sources for the claim that official inflation has been running far below reality since the early 2000s. ShadowStats argues that methodological changes, substitution, hedonic adjustments, and geometric averaging have caused CPI to miss several percentage points of inflation each year. The Chapwood Index makes a similar claim from another angle, reporting double‑digit “true” inflation in many major cities based on a fixed basket of everyday items, with no quality or substitution adjustments (Williams, 2023, & Chapwood Index, n.d.).
In this section, I use those critiques as a stress test for the “CPI understates inflation” story because they are the most widely cited examples of that view. Both ShadowStats and the Chapwood Index point to a similar bottom line: that CPI has understated inflation by at least 7 percentage points a year since around 2000. For consistency with earlier parts of the Food Puzzle, I apply that implied understatement, an extra 7 percentage points a year, to the same food basket, incomes, and housing data used before. As we will see, this pushes the numbers into a different kind of implausibility. They imply 73-87% real price declines for staple foods and 60-75% real declines in wages, home prices, and GDP per capita since 1980, patterns we simply do not observe in either the physical data or everyday life.
How to Read the Data in This Post
Unless otherwise noted, all dollar figures in this section are expressed in 2024 dollars using either the official CPI‑U or a ShadowStats/Chapwood‑style upward adjustment to CPI‑U, as specified in each table or figure. The charts and tables draw on standard public datasets, USDA (NASS and ERS), BLS, Census, FRED, MeasuringWorth, Macrotrends, and similar population series so nothing here depends on exotic or private sources. Where I use a ShadowStats/Chapwood‑style adjustment, the goal is to test that framework against the Food Puzzle, not to present it as the default method for measuring inflation.
To keep the main story readable, I limit in‑text citations and technical details; each figure has a short caption explaining how it was calculated, which datasets it uses, and whether it relies on official CPI‑U or a ShadowStats/Chapwood‑style path. A Methods and Sources section at the end lists all underlying series, transformations, and inflation adjustments, so anyone who wants to audit or recreate the charts can do so.
Why ShadowStats and Chapwood Say CPI Is Too Low
Before we dive into the results of the stress test, it is important to understand why ShadowStats and the Chapwood Index believe CPI is understating inflation by so much in the first place.
ShadowStats: Re‑creating an Older CPI
ShadowStats argues that methodological changes to the CPI since the early 1980s, such as allowing consumers to substitute cheaper goods, adjusting for quality improvements, and using geometric rather than arithmetic averaging, have caused the official index to understate true inflation. Its SGS‑Alternate CPI series is presented as a reconstruction of pre‑1980 methods (or approximations of them) and typically shows inflation running several percentage points higher than the official CPI each year (Williams, 2023).
In practice, this translates into a claimed understatement of roughly 7 percentage points per year in recent decades, with some estimates suggesting closer to 9 percentage points since 2000, and cumulative price increases exceeding 600%. In his own methodological notes, Williams explains that the ShadowStats‑Alternate CPI series is built by reverse‑engineering the BLS CPI‑U‑RS research series and adding estimates of the inflation effects of various methodological changes “on an additive basis,” and that “the series is not recalculated” from underlying price data. In other words, the SGS‑Alternate CPI is an adjusted version of the official index, not a fully independent reconstruction from raw prices. For this analysis, I set those debates aside and simply take the published divergence at face value, adding 7 percentage points to reported CPI inflation from 2000 onward (Williams, 2008 & Williams, 2023).
The Chapwood Index: A Fixed Everyday Basket
The Chapwood Index, created by investment adviser Ed Butowsky, makes a similar case from a different angle. It claims that official CPI misses the true rise in the cost of living because it does not fully capture price increases in everyday essentials across U.S. cities. Chapwood tracks prices for 150 frequently purchased items, groceries, utilities, insurance, entertainment, and local services in the 50 largest metropolitan areas. They use a fixed basket with no quality or substitution adjustments and simply report the raw percentage change each year (Chapwood Index, n.d.).
The index routinely shows inflation 7–10 percentage points, or more, higher than CPI, with some city‑level readings in the low‑ to mid‑teens (for example, around 13–14 percent in some recent years versus roughly 3–4 percent in official CPI). Butowsky and his supporters present this as the “real” erosion of purchasing power, arguing that “the CPI no longer measures the true increase required to maintain a constant standard of living” (Chapwood Index, n.d.).
The Stress Test
Now that we’ve seen why ShadowStats and the Chapwood Index think CPI is missing so much inflation, we can ask the key question for this series: how do their numbers hold up when we run them through the Food Puzzle stress test? The results are striking. Applying their adjustments to CPI produces extraordinary apparent price declines since 1980. Real food prices fall 73-87% across categories, far beyond even the most optimistic reading of agricultural productivity gains.
USDA data indicate agricultural Total Factor Productivity growth of about 1.49 percent per year from 1948 to 2021; compounded over four decades, that might reasonably imply real food price reductions of 40–60 percent for many staples. A 73–87 percent drop overshoots this dramatically, implying a kind of hidden hyper‑deflation that we simply do not see in either living standards or actual market behavior.
How Wages and House Prices Compare after the Adjustment.
The distortion becomes even clearer when we look beyond food prices to wages, housing, and overall output. Under a 7‑point understatement adjustment, the 1980 median household income of about $17,710 would equate to roughly $337,569 in 2024 terms. This implies real household incomes have fallen around 75% since 1980. Median home prices (about $66,400 in 1980) would translate to roughly $1.27 million today, suggesting real home prices have declined by about 67%, and GDP per capita shows a similar real drop of roughly 64%.
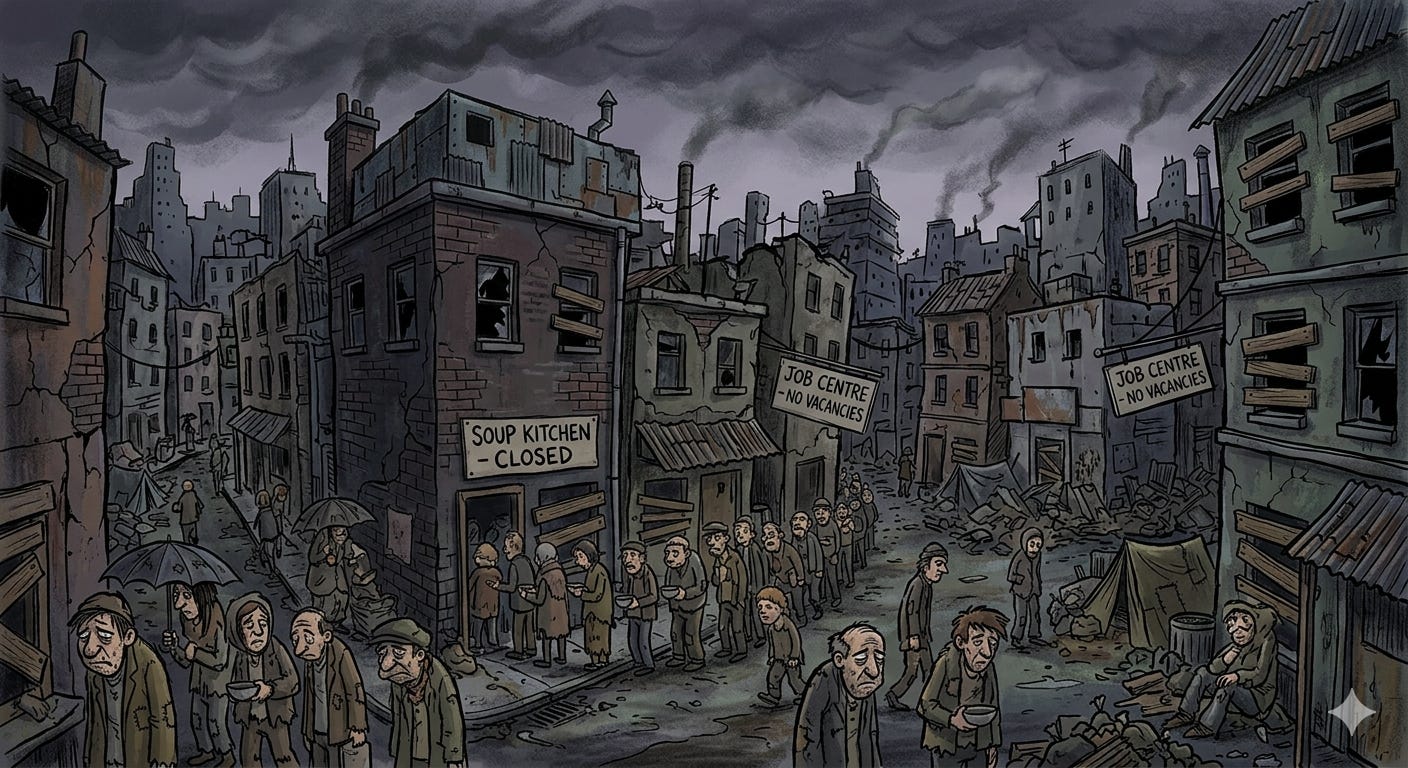
If any of this were accurate, we would be living through an economic depression far worse than the 1930s: widespread poverty, collapsing living standards, and mass unemployment on a scale that would dominate history books. Instead, the U.S. has seen ongoing, if uneven, growth in real consumption and rapid technological progress, with nothing resembling the collapse implied by these numbers. ShadowStats and Chapwood don’t just fail the stress test. They require a hidden economic catastrophe that somehow left no trace in the physical world.
The Catastrophic Results of the Stress Test
Taken together, the Boskin correction and the ShadowStats/Chapwood adjustments push us into opposite but equally unrealistic worlds. One turns a productivity‑rich food system into a sector with rising prices. The other implies wage and price collapses so extreme that we would be living through a depression worse than the 1930s. Neither picture matches the physical data or everyday experience.
Before we discard them entirely, it is worth giving all three CPI interpretations one final, neutral test. Classical monetary theory says that, over time, inflation should largely reflect the expansion of the money supply. In the next section, we line up official CPI, the Boskin‑adjusted index, the 7‑percent‑understatement path, and my proposed 1.5‑percent drift against M2 money per person (adjusted for velocity) to see which, if any, tracks the monetary inflation we have created.
Next: With both extremes eliminated, one interpretation remains, and it can be tested against the money supply itself. Continue to "The Final Straw: Comparing Inflation Metrics to Monetary Expansion."
Methods and Sources
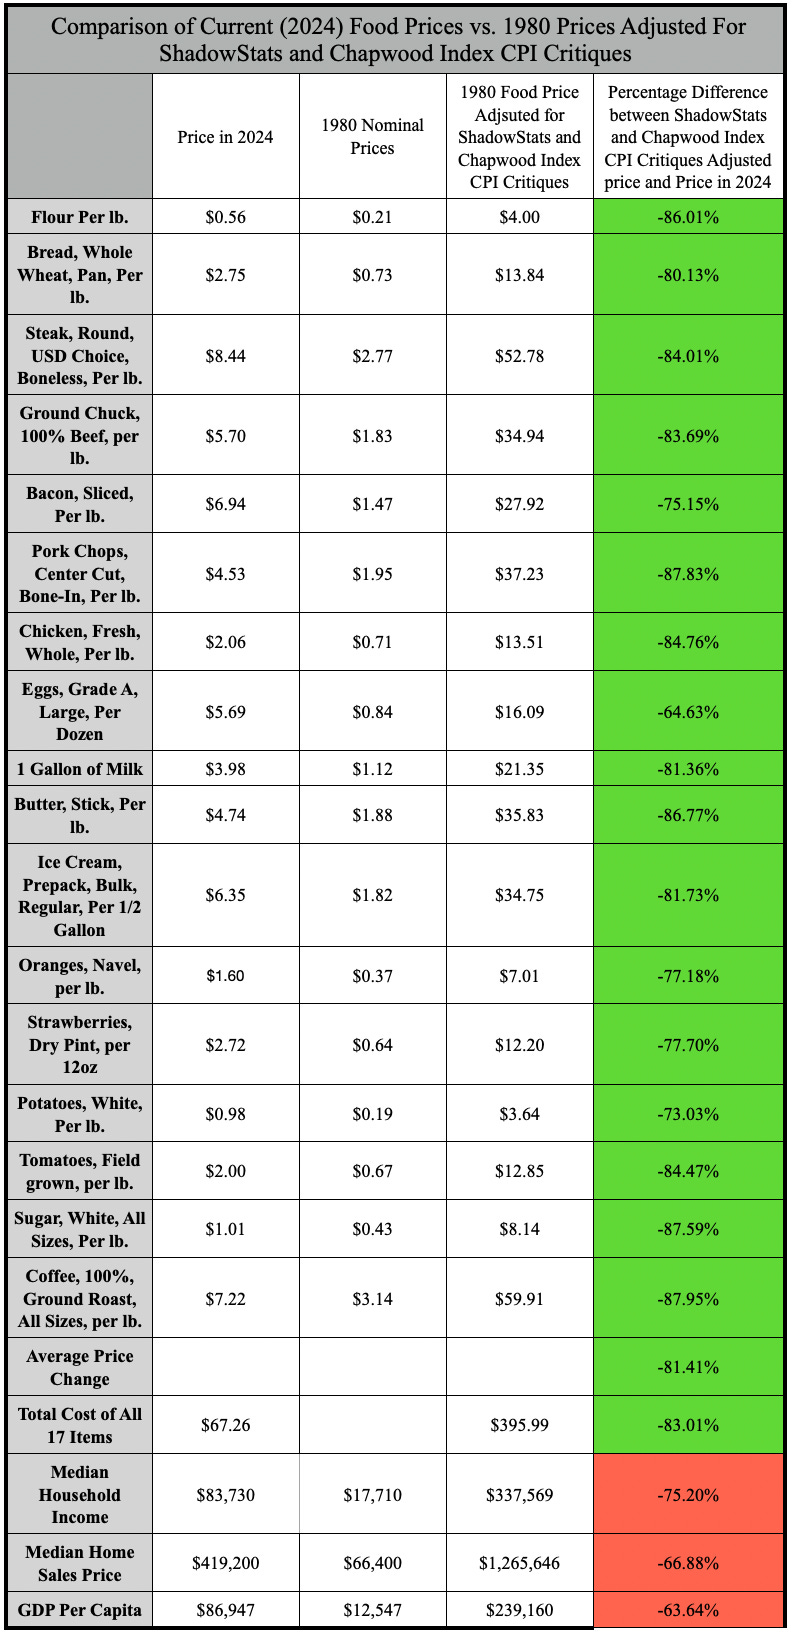
Comparison of Current (2024) Food Prices vs. 1980 Prices Adjusted for ShadowStats and Chapwood CPI Critiques
All price and income figures are converted to 2024 dollars using a ShadowStats/Chapwood‑style understatement adjustment to CPI‑U before comparison.
Food item prices: For each of the 17 food items, nominal monthly prices for 1980 and 2024 are taken from the BLS Average Price (AP) series and averaged over the 12 months to get an annual price for each year. The 1980 annual prices are then rolled forward to 2024 by taking the official CPI‑U inflation path and adding 7 percentage points to the annual inflation rate from 2000 onward, reflecting the minimum understatement implied by ShadowStats and the Chapwood Index. This produces ShadowStats/Chapwood‑adjusted 2024‑dollar values, which are compared with actual 2024 prices to compute percentage differences. The “average price change” row is the simple mean of these 17 percentage differences.
Income and housing: Median household income is taken from Census historical income tables; median home prices from the FRED MSPUS series. The 1980 values are inflated to 2024 dollars using the same ShadowStats/Chapwood‑style adjustment (official CPI through 1999, then CPI plus 7 percentage points per year from 2000 onward) before computing percentage differences, so income and housing are treated on the same basis as the food basket.
GDP per capita: GDP levels are assembled from MeasuringWorth and FRED, with population from Maddison‑style estimates and Macrotrends. I compute GDP per capita as real GDP ÷ population, then express the 1980 value in 2024 dollars using the same ShadowStats/Chapwood‑adjusted CPI path where needed, to match the treatment of other income variables.
Sources
Bolt, J., & van Zanden, J. L. (2024). Maddison style estimates of the evolution of the world economy: A new 2023 update. Journal of Economic Surveys, 38(1), 1–41. https://doi.org/10.1111/joes.12618
Bureau of Labor Statistics. (2026). Consumer price index for all urban consumers (CPI‑U) Dataset. U.S. Department of Labor. https://www.bls.gov/cpi/
Chapwood Index. (n.d.). The Chapwood Index: Our solution. Retrieved January 4, 2026, from https://chapwoodindex.com/the-solution/
Federal Reserve Bank of St. Louis. (2024). Gross domestic product (GDP) Dataset. FRED, Federal Reserve Bank of St. Louis. https://fred.stlouisfed.org/series/GDP
Federal Reserve Bank of St. Louis. (2024). Median sales price of houses sold for the United States (MSPUS) Dataset. FRED, Federal Reserve Bank of St. Louis. https://fred.stlouisfed.org/series/MSPUS
Macrotrends. (2025). United States population 1820–2024 Dataset. Macrotrends LLC. https://www.macrotrends.net/global-metrics/countries/usa/united-states/population
U.S. Bureau of Labor Statistics. (2024). Average price data (AP), U.S. city average Dataset. U.S. Department of Labor. https://www.bls.gov/charts/consumer-price-index/consumer-price-index-average-price-data.htm
U.S. Census Bureau. (2024). Historical income tables: Households Dataset. U.S. Department of Commerce. https://www.census.gov/data/tables/time-series/demo/income-poverty/historical-income-households.html
Williamson, S. H. (2025). What was the U.S. GDP then? MeasuringWorth. http://www.measuringworth.org/usgdp/
Williams, J. (2008, September 10). Response to BLS article on CPI misconceptions. Special comment. Shadow Government Statistics. http://www.shadowstats.com/article/special-comment
Williams, J. (2023, June 14). Shadow Government Statistics: Analysis behind and beyond the economic reporting. Retrieved January 4, 2026, from https://www.shadowstats.com/alternate_data/inflation-charts
Author: Kyle Novack
April 28, 2026
A Monumental Venture, LLC: research project (Novack Equilibrium Theory – NETs)
Attribution Required: © 2025–2026 Kyle Novack / Monumental Venture, LLC. For educational use with credit; commercial use requires permission. Full details in linked PDFs.