
The Economy's Most Important Number Is Miscalibrated
This all started with a simple question.

If we keep getting more productive at building things and providing services, why does the cost of living keep going up at the same time? Those two things should not both be true at the same time. Productivity is supposed to make things cheaper. That is the whole point of getting better at something. And yet here we are, more efficient than ever at producing almost everything, and more squeezed than ever at the household level.
That contradiction is what the Novack Equilibrium Theory is built on. And the answer to it changes everything that follows.
When a company invests in better equipment, more efficient processes, or improved technology, the goal is almost always the same: to reduce the cost of production. That’s not ideology, that’s the basic logic of capital investment. You spend money now to spend less money later.
If that is true across the economy, and the data shows it is, then follow the logic forward. A century of relentless productivity growth means a century of costs falling relative to output. When costs fall faster than prices do, the difference goes somewhere. The question is where.
To profit margins?
But that is not what the data shows.
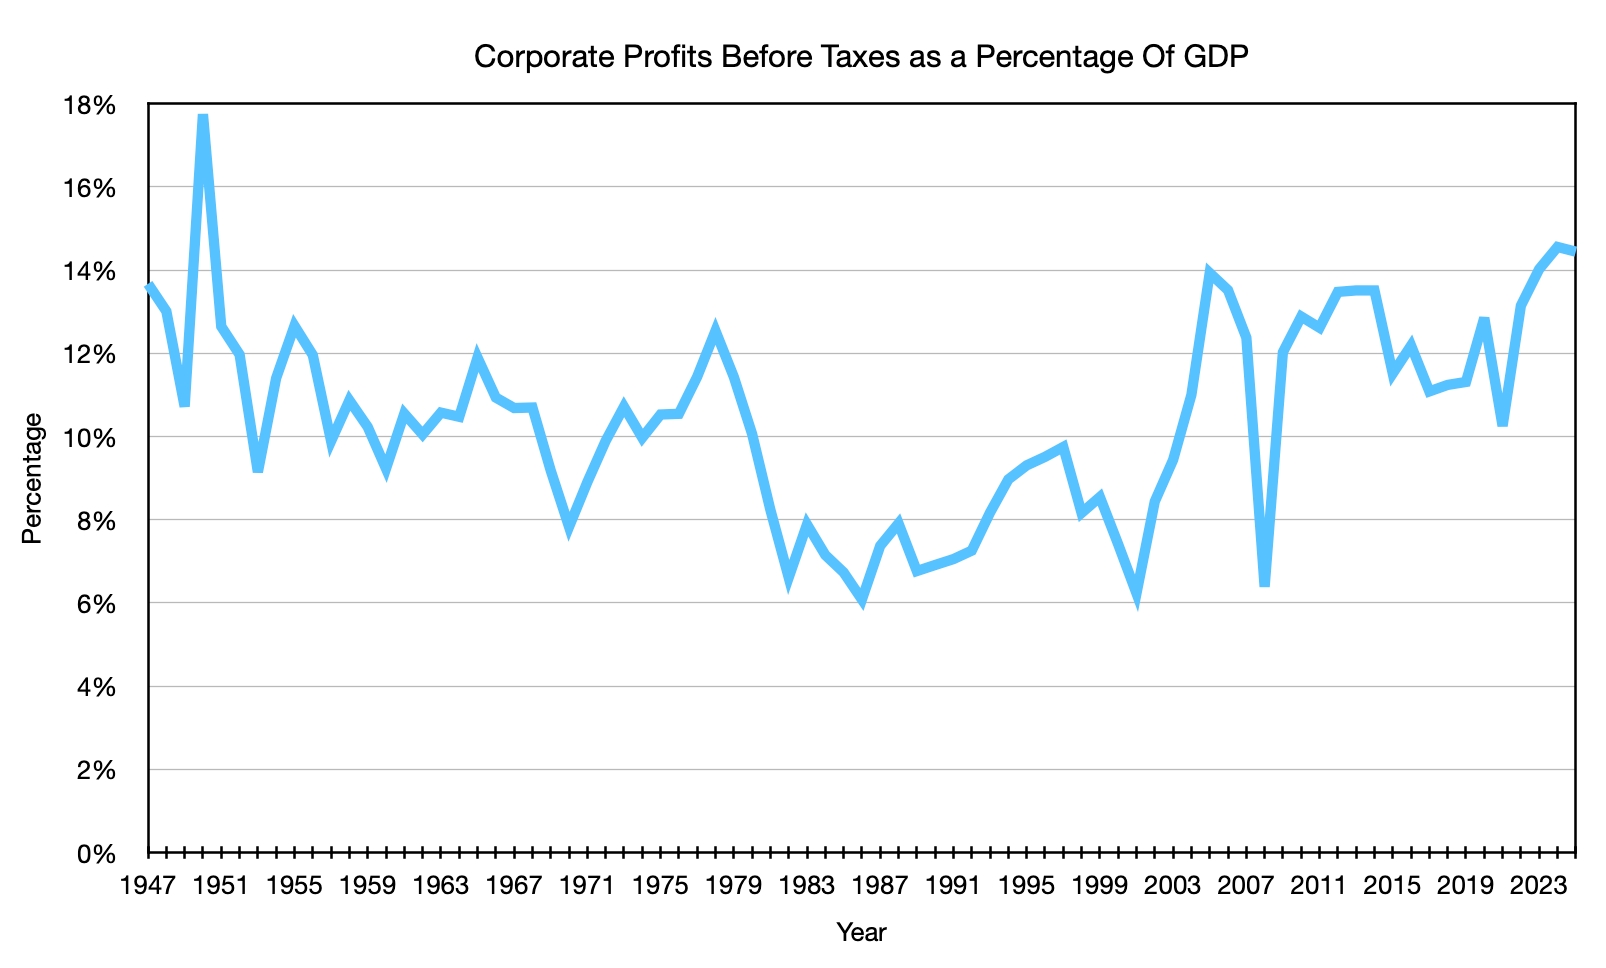
Corporate profit margins today sit on the higher end of their historical range, currently around 14-15% of GDP, compared to a long-run center of gravity closer to 9-12%. That elevated reading is worth acknowledging honestly. But context matters. The economy today is meaningfully different in composition from the economy of 1947. Technology and software companies, which structurally carry higher profit margins than manufacturing, agriculture, or retail, now make up a far larger share of overall economic output than they did a generation ago. What appears to be rising corporate greed in the aggregate is more accurately described as a shift in the economy’s distribution. The kinds of businesses that now dominate the index are simply different from those that dominated it seventy-five years ago.
But here is where the math becomes difficult to escape. CPI itself acknowledges that the dollar has lost approximately 92.5% of its purchasing power since 1947, meaning you need roughly $13.49 today to buy what one dollar bought in 1947. That is an enormous cumulative debasement of the currency over the measurement period. If corporations were systematically capturing even a fraction of the productivity dividend on top of that monetary expansion, compounding annually over 77 years, the effect on profit margins would be dramatic and visible.
Consider what the compounding math actually requires. If corporations had captured just one percent per year above inflation, a modest assumption given that we are told a century of productivity gains was flowing into corporate pockets, you can calculate the predicted result precisely. (1.01)^77 = 2.138. That means margins today would need to be roughly 114 percent higher than their 1947 baseline of 13-14% of GDP. The math predicts margins of approximately 27-30% of GDP today. We are observing 14-15%.
Lower the assumption to 0.5% annually. (1.005)^77 = 1.47. That still predicts margins of 19-21% today. Still well above what we observe. Lower it further to a quarter of one percent annually, a nearly invisible annual extraction. (1.0025)^77 = 1.21. That predicts margins of 16-17%. We are still below that threshold even under the most conservative assumption. That is before accounting for the fact that today’s elevated margins are largely attributable to the shift toward higher-margin technology businesses rather than to the systematic extraction of the productivity dividend.
The conclusion is unavoidable. The dollar has lost 92.5% of its purchasing power since 1947. Agricultural productivity tripled output while cutting inputs. And corporate margins as a percentage of GDP sit within a range that would have been recognizable to a business owner in 1955, with the elevation that does exist better explained by the composition shift toward higher-margin technology businesses than by systematic extraction of the productivity dividend. The productivity gains went somewhere. They did not go predominantly to corporate profits. And as the raw materials data show, they did not predominantly go to input costs either. Which brings us back to the same unavoidable question: where did they go?
They went to the consumer.
That’s exactly where the measurement problem begins.
In a competitive market, cost savings don’t stay with the producer forever. Competition forces them through. A manufacturer that cuts production costs but keeps prices the same creates an opening for a competitor to undercut them. Over time, and a century is a long time, competitive pressure passes most productivity gains forward as lower prices than would otherwise exist.
Notice that phrase carefully: lower prices than would otherwise exist. Not necessarily lower prices in absolute terms. Lower than they would have been without the productivity gain. A product that costs $10 today might have cost $14 today without the efficiency improvements of the last twenty years. The consumer is better off. But the price still went up from $8 two decades ago, and that’s the number CPI records.
This is where the measurement system runs into a structural problem it was never designed to solve.
What CPI Is Actually Measuring
CPI measures final prices. Not production costs. Not what it costs to extract the raw materials. Not what it costs to process, refine, manufacture, ship, or sell. The final price is what you actually pay at the register.
This seems obvious. Of course, CPI measures what things cost. That is the whole point.
But here is what that means in practice. By the time a price reaches the consumer, it has already traveled through the entire economy. Raw materials were extracted from the ground. They were processed and refined. They were manufactured into components. Those components were assembled into products. Those products moved through distribution networks and landed on shelves. At every single step of that journey, productivity gains were quietly pushing costs down, better machinery, more efficient logistics, improved agricultural yields, automation, and optimization.
And here is the critical part: by the time CPI starts measuring, all of that has already happened. The productivity dividend has already been absorbed into the final price before the measurement even begins.
This is true upstream as well. When PPI, the Producer Price Index, measures the price of components arriving at a manufacturer, those components have already been mined, processed, and shipped. Any productivity gains in mining, refining, or logistics have already been absorbed into that component price before PPI records it. The deflation is invisible at every measurement point in the chain, not just at the consumer end.
So, what CPI records is not the full story of what happened to the dollar. It records what happened to the dollar after productivity already did its work. That is a fundamentally different number.
This is the difference between net and gross inflation.
Gross inflation is the true rate at which the dollar is losing purchasing power, driven purely by monetary expansion, debt, and currency debasement.
Net inflation is what CPI measures: gross inflation minus the productivity dividend already baked into final prices before measurement begins.
CPI is doing what it was designed to do. It tracks the price movement of a basket of goods and services over time. That is a useful number. But price movement and monetary debasement are two distinct phenomena, and somewhere along the way the distinction got lost. CPI was conscripted to serve as the economy’s primary measure of monetary debasement, a job it was never built for and structurally incapable of performing accurately. Not because anyone made a calculation error. Not because the basket is wrong. But because final prices are, by definition, net of productivity, no refinement of the methodology can change that. The productivity dividend disappears into prices before CPI starts measuring. It is invisible to any system built on final prices.
Did you catch the difference? CPI is not broken. It is being asked to answer a question it was never designed to answer. And every major economic decision, interest rates, wage negotiations, pension adjustments, and GDP reporting has been calibrated against that answer for over a century. We thought we had debunked monetary debasement because the measurement said so. But the measurement was never capturing it in the first place. And yet, here we are.
Why This Matters Beyond Your Grocery Bill
Some economists will argue this is exactly what inflation is supposed to measure, the change in what your dollar buys. If productivity made things cheaper and your cost of living improved, why add the productivity dividend back in?
The answer is that the dollar isn’t just a tool for measuring your grocery bill. It is the unit against which every major economic decision gets made. Interest rates. Wage negotiations. Pension valuations. Investment returns. Entitlement adjustments. All of it is calibrated against a number that already has the productivity dividend subtracted.
But here is the deeper problem.
In every other context where economics requires precision, we are careful to compare like with like. We don’t report post-tax income and call it pre-tax income. We don’t report real GDP and call it nominal GDP. In every other case where two distinct forces act on the same number simultaneously, we separate them to understand what each force does independently.
Monetary inflation and productivity gains are two distinct forces that affect prices simultaneously, and they need to be measured and reported separately.
Gross inflation measures the true rate of currency debasement, how much purchasing power the dollar is losing purely because of monetary expansion, debt, and the forces that erode the currency’s value independent of what we produce. It answers the question: What is happening to the dollar itself?
Net inflation, what CPI measures, answers a different question: what does it cost to buy things today compared to before? That is a useful number. But it is not the same as measuring what is happening to the currency.
Before we go further, it is worth pausing on something that might sound like a weakness of this framework, but is the point. Gross inflation is a theoretical measurement. And that raises a fair question: Why use a theoretical measurement to understand something as concrete as prices?
The answer starts with understanding what money is. A dollar does not have intrinsic value. It has derived value, it is a claim on real goods and services, and its meaning comes entirely from what it can purchase, not from anything the dollar itself contains. The same is true of gold, despite what its proponents argue. Gold’s value is also derived from collective human agreement on its worth, with the modest constraint that its physical supply cannot be expanded at will. Every currency system, whether backed by fiat or commodity, is ultimately a shared theoretical framework for facilitating exchange. When you hold a twenty-dollar bill, what you are holding is a theoretical unit of exchange whose value exists only in relation to the real economy around it.
The theoretical nature of gross inflation is not a weakness of the framework. It is a direct reflection of what money is. Money is a theoretical claim on real goods and services. If you disagree, try this: explain what twenty dollars is worth without describing what it can purchase. You cannot. The value of money exists entirely in relation to the real economy around it, not in the bill itself, not in the number printed on it, not in any government decree. As a result, the debasement of that claim is also theoretical by necessity; it is the gap between what the claim was worth and what it is worth now, independent of what productivity has done to the cost of producing the things being claimed.
Here is where net inflation becomes essential rather than obsolete. The productivity dividend cannot be measured directly because it is not a price that exists anywhere; it is the difference between the price that is and the price that would have been without the productivity gain. You cannot observe a counterfactual directly. So the only path to gross inflation runs through net inflation, take what CPI gives you, add back the estimated productivity dividend derived from physical output data and total factor productivity measures, and you reconstruct the true rate at which the theoretical claim called money is losing its value. In this specific case, the measurement we have is the one we need, not as the final answer, but as the starting point for finding it.
The distinction matters because the two forces can move in opposite directions simultaneously. The currency can be debasing rapidly, while productivity gains push prices down fast enough to make the net figure look calm. CPI would report low inflation. The dollar would be losing purchasing power faster than the reported number suggests. And every economic decision calibrated against that net figure would be quietly miscalibrated as a result.
When we use net inflation to adjust gross economic figures such as wages, GDP, or government revenue, we are comparing a net figure to a gross one and treating the result as meaningful. It isn’t. The comparison is distorted before the analysis even begins, just as calculating what percentage of GDP personal income represents becomes meaningless if you use net income on one side and gross output on the other.
CPI is doing exactly what it was designed to do. It tracks the price movement of a basket of goods and services over time. That is a useful number. But price movement and monetary debasement are two distinct phenomena, and somewhere along the way the distinction got lost. CPI was conscripted to serve as the economy’s primary measure of monetary debasement, a job it was never built for and structurally incapable of performing accurately. Not because anyone made a calculation error. Not because the basket is wrong. But because final prices are net of productivity by definition, and no refinement of the methodology can change that. The productivity dividend disappears into prices before CPI starts measuring. It is invisible to any system built on final prices.
The Mainstream Already Found the Evidence. They Just Didn’t Follow It All the Way Home.
This is not a fringe claim. The Federal Reserve Bank of San Francisco explicitly documented this mechanism in 2005, in a letter written by Janet Yellen, who would later serve as Chair of the Federal Reserve and U.S. Secretary of the Treasury. Writing about the relationship between productivity and inflation, Yellen described the reductions in inflation of the prior decade as a direct counterpart to rapid productivity growth, which had aided the Fed in bringing inflation toward price stability.
Read that carefully. The Fed’s own analysis confirms that productivity growth suppresses measured inflation. That is the mechanism NETs is built on. What the San Francisco Fed described as a helpful tailwind for monetary policy, NETs identifies as a structural feature of how CPI works, one that has been quietly operating since the index was first constructed, not just during periods of exceptional productivity growth.
The Fed saw the relationship. They used it to explain short-term inflation dynamics. What they didn’t follow to its logical conclusion was this: if productivity consistently suppresses measured inflation, then CPI has never been measuring gross monetary inflation. To reiterate, it has always been measuring net inflation, gross inflation minus whatever productivity happened to absorb in that period. And a century of sustained productivity growth means a century of systematic understatement, quietly compounding in the background of every economic decision made against that number.
The result is that every downstream metric built on CPI, real wages, real GDP per capita, real returns on investment, and real government revenue is not actually measuring what it claims to measure. It is measuring something net of a force that was never accounted for. And those distorted metrics have been shaping policy, negotiating wages, and guiding investment decisions for over a century.
Understanding this dynamic is what everything else in the NETs framework relies upon. The direction of the error follows from the structure of the measurement system itself, and that structure has been confirmed by the Federal Reserve’s own research. To argue that CPI is not understating gross monetary inflation in a productive economy, you would have to argue that productivity gains do not reduce prices, a position the mainstream literature does not support.
This mechanism is almost impossible to break by counterargument. I have run through multiple scenarios of how this dynamic could fail to hold, and I cannot find a single one that makes it untrue. If you can find one, the comments are open. That is not a challenge made from arrogance; it is an invitation made from genuine curiosity. The only way this theory gets stronger is if someone finds the crack. Here are the most impactful counterarguments I have considered.
The Seven Attacks on the Mechanism
CPI Already Accounts for Productivity Through Quality Adjustment
CPI Is Measuring What It Was Designed To Measure
Input Costs Absorbed the Productivity Dividend
Yellen Was Describing Short-Run Dynamics, Not Long-Run Structural Bias
The Magnitude Cannot Be Constant
The Boskin Commission Already Identified and Corrected for This
The Circularity Problem
Which means we are no longer arguing about whether CPI is mismeasuring inflation in a productive economy. That question is answered by the mechanism. The only question that remains is magnitude.
Based on five independent data sources, agricultural productivity, housing prices, monetary expansion, wage data, and the existing bias literature, the evidence converges on a range of 1.2-1.8 percentage points per year. The central estimate is 1.5%.
That is the 1.5% drift. Not a guess. Not a grievance. A magnitude estimate for an error whose direction was already guaranteed by the structure of the measurement system itself.
Everything that follows in the NETs framework is the evidence that 1.5% is the right number.
Ready to follow the evidence? Start with the Food Puzzle.
Need the full map first? Visit the Start Here library.
References
Yellen, J. L. (2005, February). Productivity and inflation. Federal Reserve Bank of San Francisco Economic Letter, 2005-04. https://www.frbsf.org/research-and-insights/publications/economic-letter/2005/02/productivity-and-inflation/
U.S. Bureau of Economic Analysis via Federal Reserve Bank of St. Louis. (2024). National income: Corporate profits before tax (without IVA and CCAdj) [Data set]. FRED series A053RC1Q027SBEA. https://fred.stlouisfed.org/series/A053RC1Q027SBEA
Federal Reserve Bank of St. Louis. (2024). Gross domestic product [Data set]. FRED series GDP. https://fred.stlouisfed.org/series/GDP
Author: Kyle Novack
May 9, 2026
A Monumental Venture, LLC: research project (Novack Equilibrium Theory – NETs)
Attribution Required: © 2025–2026 Kyle Novack / Monumental Venture, LLC. For educational use with credit; commercial use requires permission. Full details in linked PDFs.