
The NETs Library: The archive.
Your feelings about the economy are not just nostalgia. Here's the proof.
How This All Began
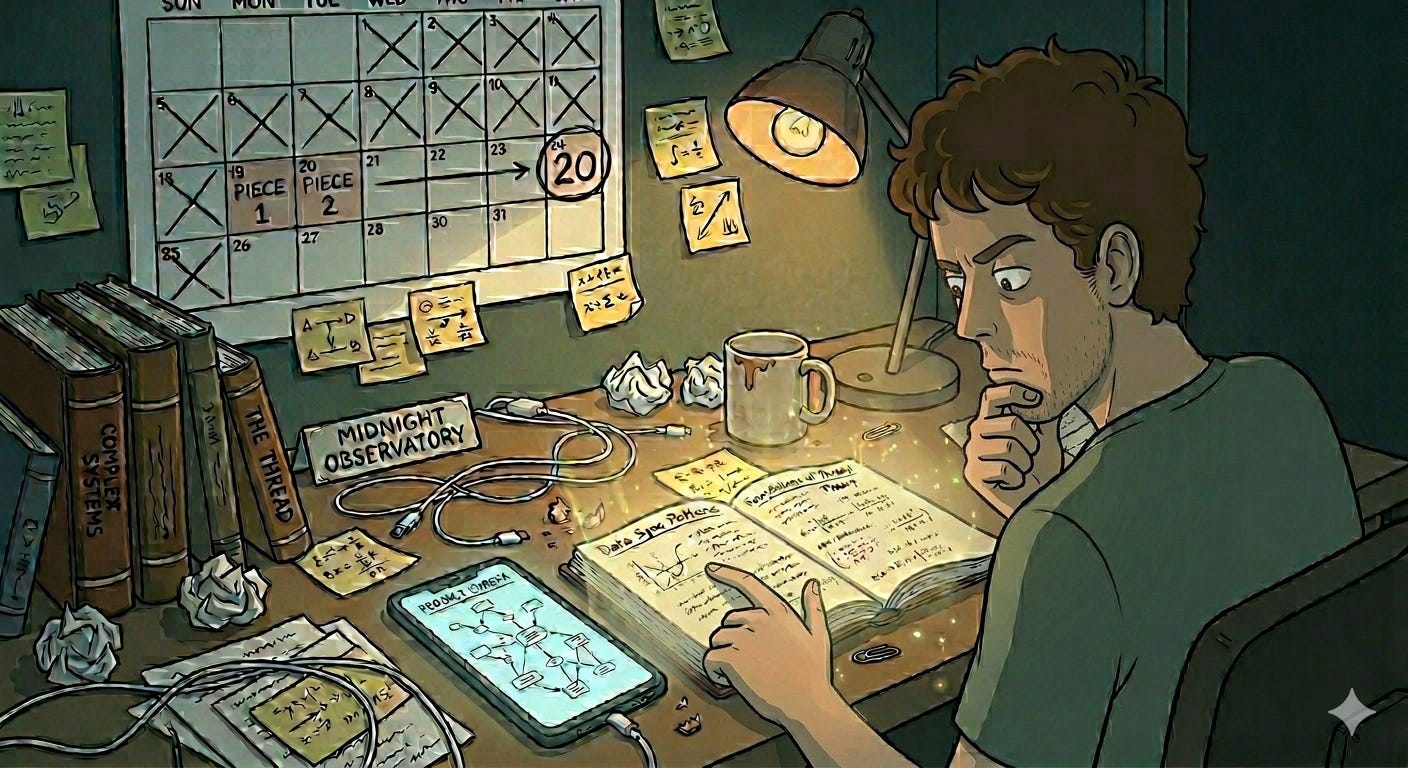
How I Realized the Numbers Were Lying to Us: We keep getting better at making things. Farms produce more, factories produce more, and technology does more with less. So why does life keep getting harder to afford? That contradiction wouldn't leave, and this is the story of where chasing it led.
New to NETs? Start Here
A Warped Economy Does Not Announce Itself. It Just Makes Tuesday a Little Harder Every Year: Sarah, a nurse earning $94,000 a year, cannot explain why she puts groceries back at checkout. Mike runs a manufacturing plant and cannot explain why doing everything right still ends with him moving jobs overseas. They have never met, they blame different things, and they are both correct about what they see. This piece is about what it looks like when a measurement error compounds for fifty years, and why the gap between the official story and real life is not a conspiracy. It is a design flaw nobody fixed.
Two Words Were Taken From You So Slowly You Never Felt Them Leave: “Economy” and “politics” did not start as expert territory. They started as yours. This piece traces how two ancient words built around the household and the citizen drifted so far from their origins that most people stopped recognizing themselves in them, and why getting them back is the first act of the argument that follows.
Economics Made Simple: Why Your Household Budget Explains Everything: You already understand more economics than you think. This piece shows how running a household and running a national economy follow the exact same logic, and why that matters for everything NETs is arguing.
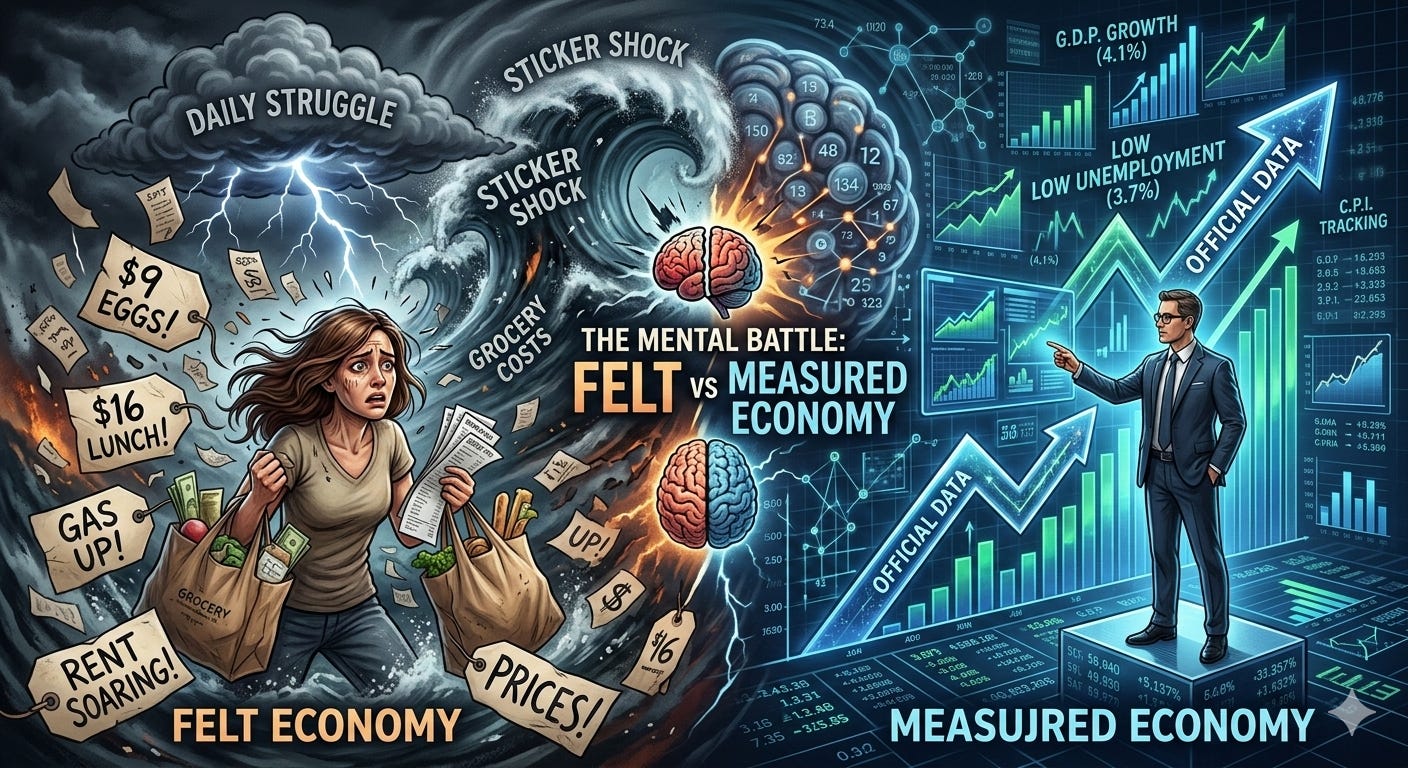
When the Numbers Gaslight You: The Felt vs. Measured Economy: The economy looks fine on paper. Your wallet disagrees. This piece explains why both things are true, and why your gut is actually the more accurate signal.
Human Time Is the Real Currency of the Economy: If the dollar is a broken measuring stick, what should we measure value in instead? The answer is the one thing nobody can print more of.
The Two Economies: Why Your Gut Beats the Official Numbers: What happens when you fix the inflation ruler? Wages, Big Macs, and corporate profits all start telling a very different story than the one in the headlines.
Why Food Has to Be Cheap for Everything Else to Exist: Food isn’t cheap because it matters less than other things. It’s cheap because it matters more than everything else, and this piece explains why that distinction is the key to understanding where the 1.5% drift shows up most painfully in your daily life.
Back to Basics: What Economics Really Measures: A plain-language reset on the core vocabulary of economics, the foundation you need before the bigger arguments start to build on top of it.
The CPI Series: Why the Number That Runs the Economy Might Be Wrong
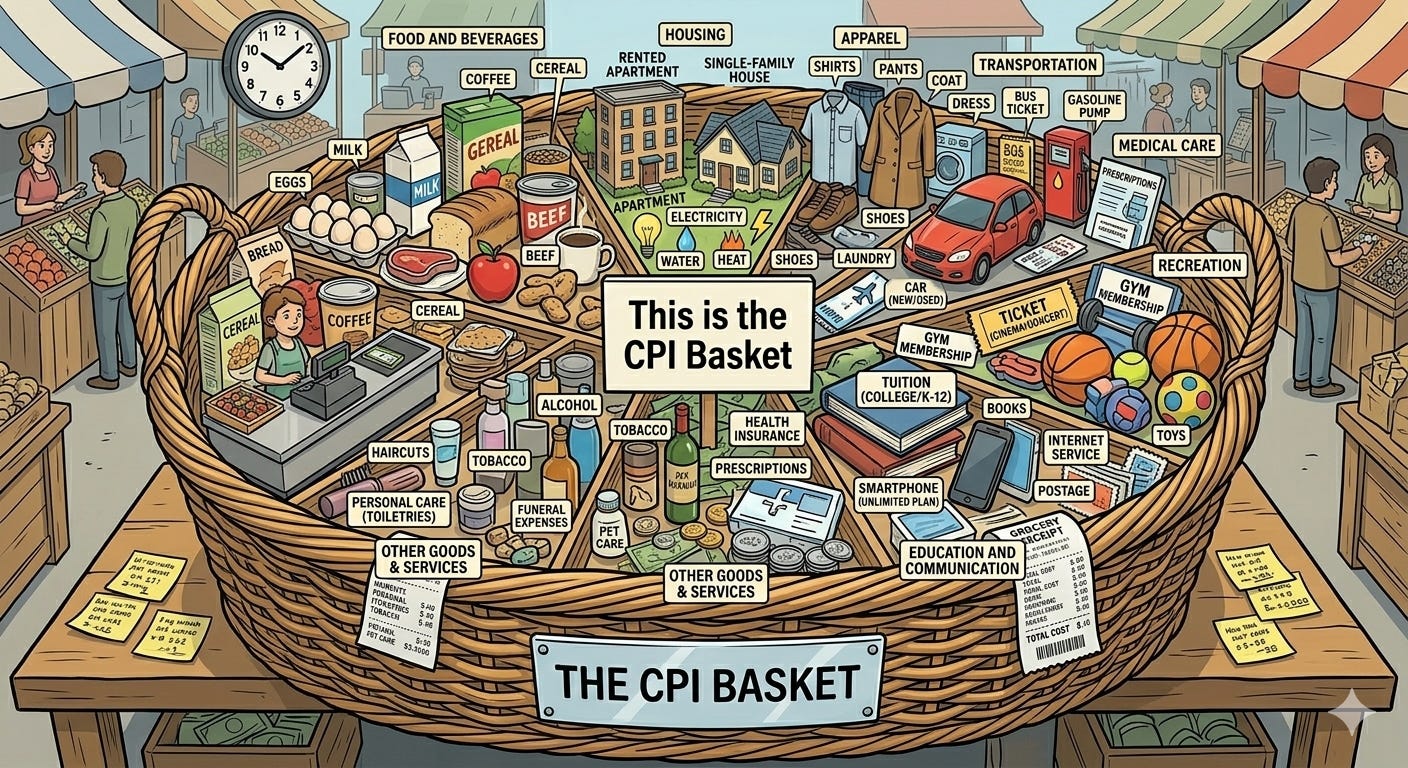
Part 1:What Is CPI, and Why Does It Run the Economy? Every interest rate decision, every wage negotiation, every inflation-adjusted number in the economy runs through one index. This piece explains what CPI actually is, how it gets built, and why getting it wrong has consequences that reach into every corner of your financial life.
Part 2 : Why Measuring Inflation Is Like Baking Grandma’s Chocolate Cake: CPI has a problem that has nothing to do with incompetence; it was always measuring a moving target. This piece explains why that’s already hard enough, and then introduces the part nobody anticipated: a shrinking measuring stick hidden behind ingredients that kept getting better
Part 3: Close Enough to Trust, Wrong Enough to Matter: The loudest critics of CPI are looking in the wrong place. This piece runs the math on the most common objections, weight manipulation, basket selection, hedonic adjustments, and shows why none of them can produce a meaningful headline error, then asks the question nobody thought to ask: what if CPI is working correctly and something is still systematically wrong?
Part 4: The Silent Ghost That Distorted a Century of Measurement: The flaw in CPI isn’t in how it was built or maintained; it’s in what price-based measurement is structurally incapable of seeing. This piece identifies productivity as the silent force already absorbed into final prices before CPI starts measuring, explains the difference between net and gross inflation, and shows what a century of measuring the wrong number has done to every inflation-adjusted figure in the economy.
Part 5: The Chaos Before the Dollar: America has tried to solve the same monetary problem since its founding, and failed in a different way each time. This piece traces the full arc, from the Continentals to wildcat banking to the panics of the 1800s, to show why the secret meeting on Jekyll Island wasn’t a conspiracy; it was the inevitable product of 120 years of things breaking.
Part 6: The Rescue That Couldn’t Be Trusted to Happen Again: In 1907, one private citizen, J.P. Morgan, saved the American financial system through sheer force of will and personal capital. This piece explains why that success was the most frightening possible outcome: it proved the system worked only because the right man happened to be in the right room, and a country cannot organize its financial survival around that kind of luck.
Part 7: The Gold Trap: The gold standard wasn’t a bad idea; it was the right answer to a different world. This piece traces how the discipline that once kept currencies honest became the mechanism that turned a bad recession into the Great Depression, and why the constraint that was supposed to protect everyone ended up trapping them instead.
Part 8: No More Gold. So What Runs the Money Now? On a Sunday night in August 1971, Nixon cut the last link between the dollar and gold, and the question that had anchored monetary policy for two centuries suddenly had no answer. This piece follows the chain from that night through the Volcker shock and into the present, ending at the number that replaced gold as the foundation of the entire system: CPI.
The Food Puzzle Series
Food Puzzle Master Summary: All 15 parts of the Food Puzzle series distilled into five pages, the core paradox, the suspects that were eliminated, the stress test results, and the conclusion. I always recommend reading the full series, as this summary necessarily oversimplifies some of the arguments, but I understand not everyone has the time.
Part 1: Why Agriculture Is the Perfect Smoking Gun: If CPI has a flaw, agriculture is the best place to find it. A century of clean USDA data, a product that barely changes, and a productivity boom so large it should be impossible to miss. This is where the investigation begins.
Part 2: The Money World Paradox, Where Did All the Savings Go? The physical story is clear: more food, fewer people, less land. So why doesn’t the dollar data show the savings that should be there? This is the moment the puzzle becomes undeniable.
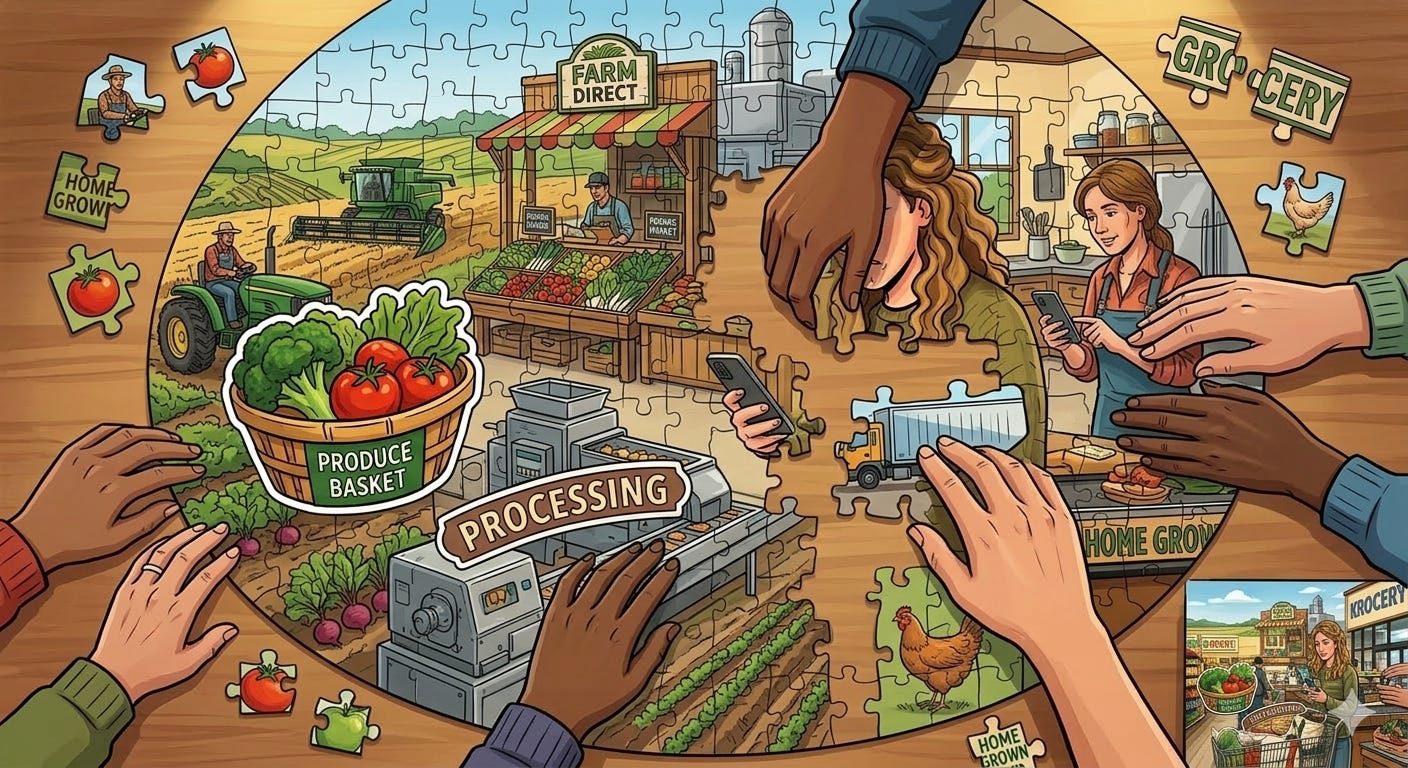
Part 3: From Farm Gate to Cart, The Missing Miracle: Maybe the savings disappeared between the farm and the grocery aisle. This piece follows the crops out of the field and into your cart to find out, and the answer is more surprising than you’d expect.
Part 4: The Supply Chain Heist Part 1: The supply chain is the most obvious suspect. Packaging, transportation, labor, did one of them quietly absorb the farm’s productivity dividend before it reached consumers? Step up to the witness stand.
Part 5: The Supply Chain Heist Part 2: The supply chain is still on the stand. This time we go deeper, and find that the middlemen were actually getting more efficient too. The testimony doesn’t hold up.
Part 6: Big Food and Greedflation, What the Margins Actually Show: The supply chain has been dismissed. Next suspect: the corporations themselves. The charge is greedflation, using market power to pocket the productivity dividend consumers never received. The financial records are now entered into evidence.
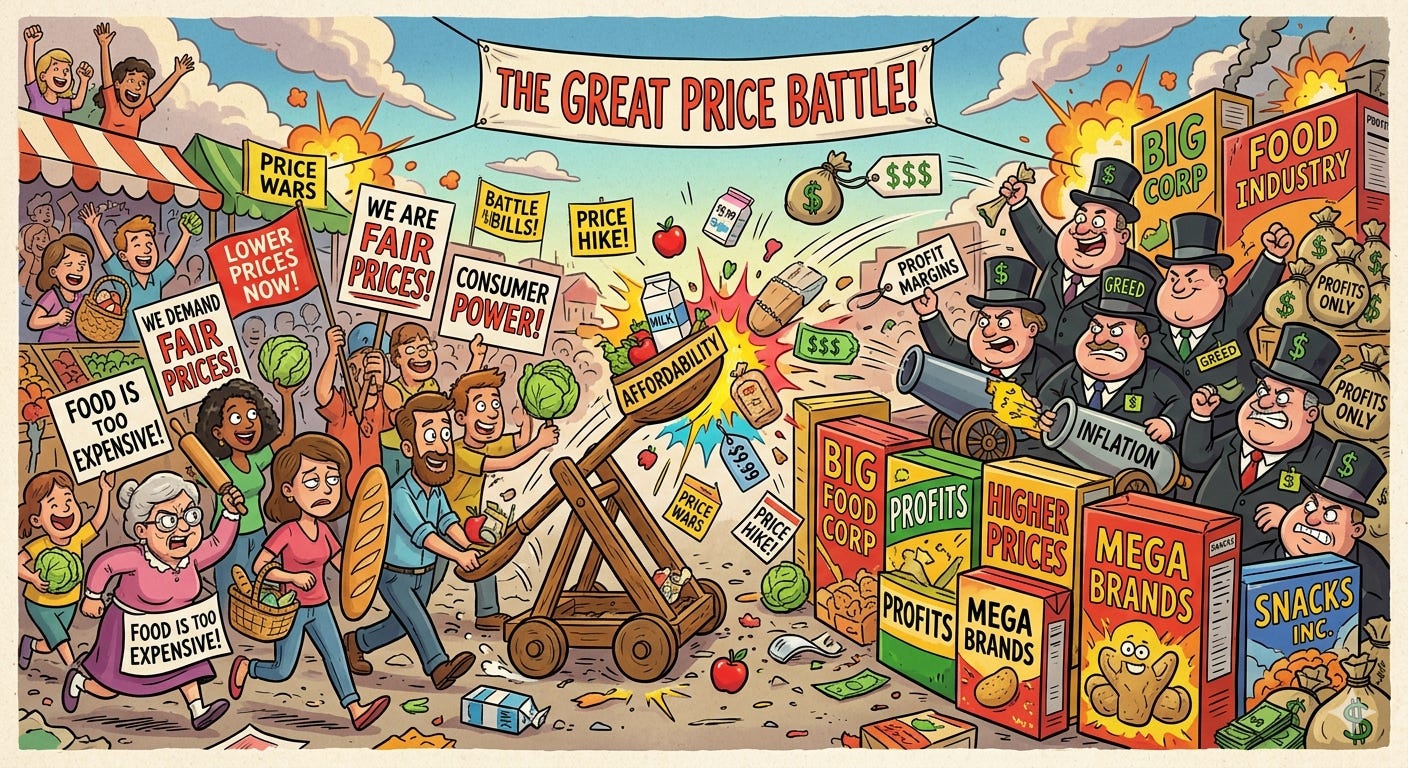
Part 7: Why Markets Won’t Let Food Stay Expensive: The corporate case is weakening. This piece examines the structural reason why even the most powerful food companies can’t sustain elevated prices for long, and why the market itself keeps working against the greedflation story. For a deeper dive into the functional vs. priced utility argument, read Why We Hate Paying More for Groceries.
Part 8: Scarcity Was Never the Problem: With corporate power struggling to hold up under cross-examination, we call a new witness: external shocks. Droughts, wars, pandemics, energy spikes, could a century of bad luck explain what the other suspects couldn’t? Step up to the witness stand.
Part 9: How Regulation Touches, But Doesn’t Explain, Food Prices: One suspect remains before we turn the lens on the measurement system itself. Regulation, step up to the witness stand. The compliance costs are real, but are they anywhere near large enough to absorb an agricultural revolution?
Part 10: CPI at Odds with the Food Economy: Every physical suspect has been dismissed. That leaves one place left to look: the measurement system itself. This piece makes the formal case for CPI’s structural blind spot to productivity-driven price declines.
Part 11: Believing CPI Overstates Inflation Only Deepens the Food Puzzle: The Boskin Commission famously argued CPI overstates inflation. What happens when you apply that correction to the Food Puzzle? The gap gets wider, not smaller.
Part 12: Why Severe Understatement of Inflation Goes Too Far: On the other end of the spectrum, ShadowStats and the Chapwood Index claim CPI misses inflation by 7+ points a year. This piece applies that correction and follows it to its logical conclusion, a picture so extreme it can’t be reconciled with the world anyone actually lived through.
Part 13: The Final Straw. Comparing Inflation Metrics to Monetary Expansion: Updated May 2026. With the extremes eliminated, one interpretation remains. This piece lines up all four inflation readings against the money supply and asks which one classical monetary theory would actually predict, and the answer wasn't reverse-engineered to fit. The monetary comparison section has been corrected following feedback from a well-known economist; the core conclusion is unchanged and strengthened by the fix.
Part 14: The Case Is Closed, and the Ruler Is Bent Everywhere: The Food Puzzle is solved. But the implications don’t stop at the grocery store. If the ruler is bent here, in the most data-rich, most observable sector in the economy, it’s bent everywhere it’s ever been used.
Part 15: The Overshoot Was Never a Problem, It Was Consistency: Part 14 left one question open: why did drift-adjusted prices fall even further than productivity alone would predict? This piece answers it, and is upfront about where the argument has limits and where it doesn’t.
A Different Way In: When Data Becomes Story
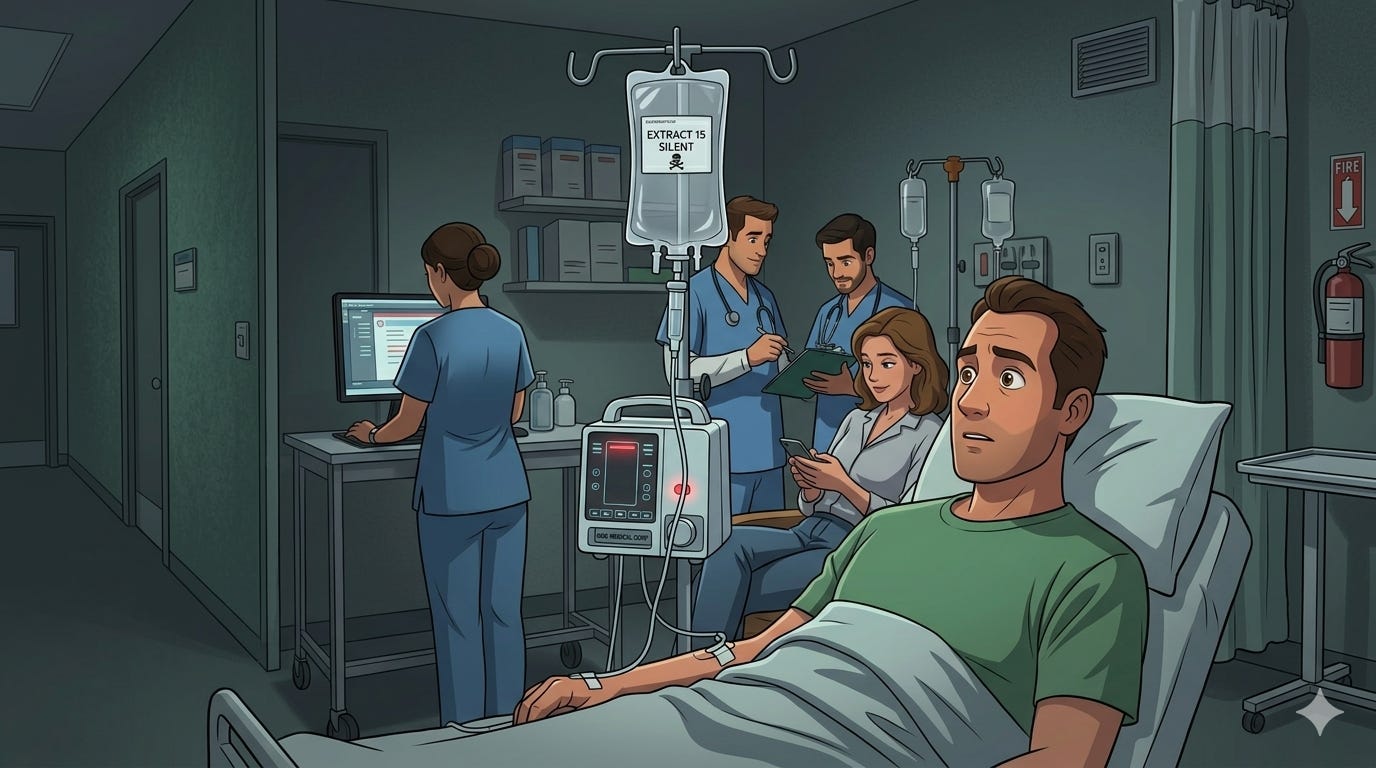
The Silent Prescription: A Story of the Hidden 1.5% Inflation Drift: A hospital. A slow-drip medication called Extract-15. And a patient whose doctors keep telling him the vitals look fine. A short allegorical story that makes the abstract mechanics of the 1.5% drift feel uncomfortably real.
Walking the Bridge to Your New Life: Building something new doesn’t feel like progress for a long time, and that’s exactly where most people quit. This piece uses the Mackinaw Bridge Walk to explain why the stretch where nothing seems to be working is actually the most important part of the journey.
Part 2: Grit on the Wrong Bridge Is Just Expensive Mileage: Most People Never Stop to Check: Hard work is not the problem. The problem is spending it on a bridge you never deliberately chose to walk. Before the playbooks, before the tactics, before the first plank goes down, there is a question that most people skip entirely: what does the shore on the other side actually look like? This piece is about doing that work first, and why everything else depends on it.
Part 3: Nobody Tells You That the Wrong Shore Can Cost You Things Money Cannot Replace: Two people built real things, made real sacrifices, and still ended up somewhere they never chose. Ashley had the credentials and then the seven-figure business. Alicia had the audience and the income. Neither of them had the shore. This piece is about what it actually costs when you skip the covenant, and why the off-ramp is always better than the leap.
Where the Economy Is Headed: Prediction

Why an Iran War Oil Shock Won’t Bring Back 1970s-Style Inflation: Spiking oil prices feel like inflation. But there’s a critical difference between prices reshuffling and the whole price floor rising, and confusing the two is how bad economic policy gets made.
For the Skeptics and Researchers
The Hidden 1.5% Inflation Gap: Technical Proof: The full mathematical case for the 1.5% annual CPI understatement. If you want the methodology, the data sources, and the quantitative proof rather than the narrative, this is where to start.
NETs: Unmasking Economic Illusions with Time-Based Truth: The master summary of the Novack Equilibrium Theory. The measurement anomaly, the Food Puzzle, the Time Token proposal, and the broader implications, all in one place for anyone who wants the full theory without the storytelling.
NETs Core Claim: The 1.5% CPI Drift: Summary Memo A concise five-page brief designed for economists and researchers. Triangulates the 1.5% drift estimate across five independent mainstream data sources, explains what the correction resolves, and lays out explicit falsification tests, the specific conditions under which the NETs’ claim would be proven wrong.
New articles publish every Tuesday and Friday at 9:30 AM EST.
Subscribe so you don’t miss the next piece of the argument as it comes together.
The only way this theory gets stronger is if someone breaks it.
If something doesn’t add up, if the data looks wrong, if you have an insight this framework hasn’t accounted for yet, say so in the comments. Every serious challenge either sharpens the argument or reveals where it still needs work. Both outcomes move this forward.